


UPDATE: i answered number 16 correctly, which is 6.2, but i am still getting number 14 and 15 wrong and i'm not sure where i am going wrong in my calculations...
Homework Answers
Marshall Inc.
Ratio Analysis for 20Y2:
| $ | ||||
| 14 | Return on common shareholders equity | (Net income -dividend on preferred stock) / Average common shareholders equity |
(817,600-10,500)/{(860,000+43,54,850)+(860,000+36,25,150)}/2 = 807,100/48,50,000 |
16.64% |
| 15 | Earnings per share on common stock | Earnings available to common shareholders/ weighted average common shares |
(817,600-10,500)/{((860,000+860,000)/2)/10} = 807,100/(860,000/10) = 807,100/86,000 |
$ 9.38 per share |
| 16 | Price earnings ratio | market price / Earnings per share | 58/9.38 | 6.18 times |
Add Answer to:
UPDATE: i answered number 16 correctly, which is 6.2, but i am
still getting number 14...
Measures of liquidity, Solvency, and Profitability The comparative financial statements of Marshall Inc. are as follows....
 Measures of liquidity, Solvency, and Profitability The comparative financial statements of Marshall Inc. are as follows. The market price of Marshall common stock was $ 58 on December 31, 20Y2. Marshall Inc. 2011 Comparative Retained Earnings Statement For the Years Ended December 31, 20Y2 and 2041 2012 Retained earnings, January 1 $3,625,150 Net income 817,600 Total $4,442,750 $3,081,850 631,200 $3,713,050 Dividends: On preferred stock $10,500 77,400 $10,500 77,400 On common stock Total dividends $87,900 $87,900 $4,354,850 Retained earnings, December 31...
eBook Calculator Measures of liquidity, Solvency, and Profitability The comparative financial statements of Marshall Inc. are...
 eBook Calculator Measures of liquidity, Solvency, and Profitability The comparative financial statements of Marshall Inc. are as follows. The market price of Marshall common stock was $ 68 on December 31, 20Y2. Marshall Inc. Comparative Retained Earnings Statement For the Years Ended December 31, 2012 and 2041 2012 2011 Retained earnings, January 1 $3,605,800 817,600 $3,033,600 621,400 Net Income Dividends: On preferred stock (10,500) On common stock (10,500) (38,700) $4,374,200 (38,700) $3,605,800 Retained earnings, December 31 Marshall Inc. Comparative Income...
NEED HELP ASAP PLEASE! (I already answered 1-4) The comparative financial statements of Marshall Inc. are...
NEED HELP ASAP PLEASE! (I already answered 1-4) The comparative financial statements of Marshall Inc. are as follows. The market price of Marshall common stock was $ 62 on December 31, 20Y2. Marshall Inc. Comparative Retained Earnings Statement For the Years Ended December 31, 20Y2 and 20Y1 20Y2 20Y1 Retained earnings, January 1 $ 3,614,400 $ 3,055,100 Net income 817,600 625,700 Total $4,432,000 $ 3,680,800 Dividends: On preferred stock $ 10,500 $ 10,500 On common stock 55,900 55,900 Total dividends...
NEED HELP ASAP PLEASE! (I already answered 1-4) The comparative financial statements of Marshall Inc. are as follows. The market price of Marshall common stock was $ 62 on December 31, 20Y2. Marsha...
NEED HELP ASAP PLEASE! (I already answered 1-4) The comparative financial statements of Marshall Inc. are as follows. The market price of Marshall common stock was $ 62 on December 31, 20Y2. Marshall Inc. Comparative Retained Earnings Statement For the Years Ended December 31, 20Y2 and 20Y1 20Y2 20Y1 Retained earnings, January 1 $ 3,614,400 $ 3,055,100 Net income 817,600 625,700 Total $4,432,000 $ 3,680,800 Dividends: On preferred stock $ 10,500 $ 10,500 On common stock 55,900 55,900 Total dividends...
5. Number of days' n receivables, 18.3 EXCEL TEMPLATE Obj. 3, 4,5 PR 14-4A Measures of...
 5. Number of days' n receivables, 18.3 EXCEL TEMPLATE Obj. 3, 4,5 PR 14-4A Measures of liquidity, solvency, and profitability The comparative financial statements of Marshall Inc, are as follows. The market price of Marshall common stock was $82.60 on December 31, 20Y2. Marshall Inc. Comparative Retained Earnings Statement For the Years Ended December 31, 20Y2 and 20Y1 2012 20Y1 Retained earnings, January 1............ $3,704,000 $3,264,000 Net income...... 600,000 550,000 Total $4,304,000 $3,814,000 Dividends: On preferred stock ......... $ 10,000...
Measures of liquidity, solvency, and profitability The comparative financial statements of Marshall Inc. are as follows....
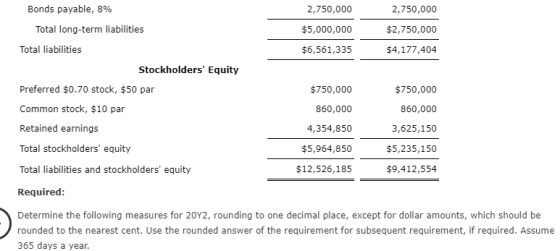
 Measures of liquidity, solvency, and profitability
The comparative financial statements of Marshall Inc. are as
follows. The market price of Marshall common stock was $82.60 on
December 31, 20Y2.
Determine the following measures for 20Y2. Round to one decimal
place, including percentages, except for per-share amounts, which
should be rounded to the nearest cent.
Working Capital
$
Current Ratio
Quick Ratio
Accounts receivable turnover
Number of days' sales in receivables
Inventory turnover
Number of days' sales in inventory
Ratio of...
Measures of liquidity, solvency, and profitability
The comparative financial statements of Marshall Inc. are as
follows. The market price of Marshall common stock was $82.60 on
December 31, 20Y2.
Determine the following measures for 20Y2. Round to one decimal
place, including percentages, except for per-share amounts, which
should be rounded to the nearest cent.
Working Capital
$
Current Ratio
Quick Ratio
Accounts receivable turnover
Number of days' sales in receivables
Inventory turnover
Number of days' sales in inventory
Ratio of...
I have answered every question except for 5 and 12-15. I cannot seem to get them...
 I have answered every question except for 5 and 12-15. I cannot
seem to get them right. Thank you.
Measures of liquidity, Solvency and Profitability The comparative financial statements of Marshall Inc. are as follows. The market price of Marshall Inc. common stock was $ 68 on December 31, 20Y2. Marshall Inc. Comparative Retained Earnings Statement For the Years Ended December 31, 20Y2 and 20Y1 2012 20Y1 Retained earnings, January 1 $ 1,190,000 $ 1,407,900 330,000 Net income 243,700 Total...
I have answered every question except for 5 and 12-15. I cannot
seem to get them right. Thank you.
Measures of liquidity, Solvency and Profitability The comparative financial statements of Marshall Inc. are as follows. The market price of Marshall Inc. common stock was $ 68 on December 31, 20Y2. Marshall Inc. Comparative Retained Earnings Statement For the Years Ended December 31, 20Y2 and 20Y1 2012 20Y1 Retained earnings, January 1 $ 1,190,000 $ 1,407,900 330,000 Net income 243,700 Total...
this is ONE problem Ch 17-3 Exercises and Problems Measures of liquidity, Solvency, and Profitability The...
 this is ONE problem
Ch 17-3 Exercises and Problems Measures of liquidity, Solvency, and Profitability The comparative financial statements of Marshall Inc. are as follows. The market price of Marshall common stock was $59 on December 31, 20Y2. 2011 Marshall Inc. Comparative Retained Earnings Statement For the Years Ended December 31, 20Y2 and 2041 2012 Retained earnings, January 1 $3,102,250 Net income 691,200 Total $3,793,450 Dividends: On preferred stock $9,100 On common stock 66,600 Total dividends $75,700 Retained earnings, December...
this is ONE problem
Ch 17-3 Exercises and Problems Measures of liquidity, Solvency, and Profitability The comparative financial statements of Marshall Inc. are as follows. The market price of Marshall common stock was $59 on December 31, 20Y2. 2011 Marshall Inc. Comparative Retained Earnings Statement For the Years Ended December 31, 20Y2 and 2041 2012 Retained earnings, January 1 $3,102,250 Net income 691,200 Total $3,793,450 Dividends: On preferred stock $9,100 On common stock 66,600 Total dividends $75,700 Retained earnings, December...
CengageNuwv2 Unline teachin X The comparative financial State X + € C → Apps v2.cengagenow.com/ilm/take Assignment/take...
 CengageNuwv2 Unline teachin X The comparative financial State X + € C → Apps v2.cengagenow.com/ilm/take Assignment/take AssignmentMain.do?invoker=&takeAssign Soundcloud World Class I Bills in Google Docs Make APA Document.docx God 1. Working capital 1,199,366 2. Current ratio 3. Quick ratio 4. Accounts receivable turnover 5.9 5. Number of days' sales in receivables 61.9 days 6. Inventory turnover 7. Number of days sales in inventory 121.7 days 8. Ratio of fixed assets to long-term liabilities 0. 97 9. Ratio of liabilities to...
Measures of liquidity, Solvency and Profitability The comparative financial statements of Marshall Inc. are as follows....
 Measures of liquidity, Solvency and Profitability The comparative financial statements of Marshall Inc. are as follows. The market price of Marshall Inc, common stock was $ 54 on December 31, 2012. Marshall Inc. Comparative Retained Earnings Statement For the Years Ended December 31, 2012 and 2041 2012 2011 Retained earnings, January 1 $ 1,028,100 $ 870,100 Net income 224,000 178,200 Total $ 1,252,100 $ 1,048,300 $ 7.700 $ 7,700 Dividends On preferred stock On common stock Total dividends Retained earnings,...
 Measures of liquidity, Solvency, and Profitability The comparative financial statements of Marshall Inc. are as follows. The market price of Marshall common stock was $ 58 on December 31, 20Y2. Marshall Inc. 2011 Comparative Retained Earnings Statement For the Years Ended December 31, 20Y2 and 2041 2012 Retained earnings, January 1 $3,625,150 Net income 817,600 Total $4,442,750 $3,081,850 631,200 $3,713,050 Dividends: On preferred stock $10,500 77,400 $10,500 77,400 On common stock Total dividends $87,900 $87,900 $4,354,850 Retained earnings, December 31...
 eBook Calculator Measures of liquidity, Solvency, and Profitability The comparative financial statements of Marshall Inc. are as follows. The market price of Marshall common stock was $ 68 on December 31, 20Y2. Marshall Inc. Comparative Retained Earnings Statement For the Years Ended December 31, 2012 and 2041 2012 2011 Retained earnings, January 1 $3,605,800 817,600 $3,033,600 621,400 Net Income Dividends: On preferred stock (10,500) On common stock (10,500) (38,700) $4,374,200 (38,700) $3,605,800 Retained earnings, December 31 Marshall Inc. Comparative Income...
 5. Number of days' n receivables, 18.3 EXCEL TEMPLATE Obj. 3, 4,5 PR 14-4A Measures of liquidity, solvency, and profitability The comparative financial statements of Marshall Inc, are as follows. The market price of Marshall common stock was $82.60 on December 31, 20Y2. Marshall Inc. Comparative Retained Earnings Statement For the Years Ended December 31, 20Y2 and 20Y1 2012 20Y1 Retained earnings, January 1............ $3,704,000 $3,264,000 Net income...... 600,000 550,000 Total $4,304,000 $3,814,000 Dividends: On preferred stock ......... $ 10,000...
 Measures of liquidity, solvency, and profitability
The comparative financial statements of Marshall Inc. are as
follows. The market price of Marshall common stock was $82.60 on
December 31, 20Y2.
Determine the following measures for 20Y2. Round to one decimal
place, including percentages, except for per-share amounts, which
should be rounded to the nearest cent.
Working Capital
$
Current Ratio
Quick Ratio
Accounts receivable turnover
Number of days' sales in receivables
Inventory turnover
Number of days' sales in inventory
Ratio of...
Measures of liquidity, solvency, and profitability
The comparative financial statements of Marshall Inc. are as
follows. The market price of Marshall common stock was $82.60 on
December 31, 20Y2.
Determine the following measures for 20Y2. Round to one decimal
place, including percentages, except for per-share amounts, which
should be rounded to the nearest cent.
Working Capital
$
Current Ratio
Quick Ratio
Accounts receivable turnover
Number of days' sales in receivables
Inventory turnover
Number of days' sales in inventory
Ratio of...
 I have answered every question except for 5 and 12-15. I cannot
seem to get them right. Thank you.
Measures of liquidity, Solvency and Profitability The comparative financial statements of Marshall Inc. are as follows. The market price of Marshall Inc. common stock was $ 68 on December 31, 20Y2. Marshall Inc. Comparative Retained Earnings Statement For the Years Ended December 31, 20Y2 and 20Y1 2012 20Y1 Retained earnings, January 1 $ 1,190,000 $ 1,407,900 330,000 Net income 243,700 Total...
I have answered every question except for 5 and 12-15. I cannot
seem to get them right. Thank you.
Measures of liquidity, Solvency and Profitability The comparative financial statements of Marshall Inc. are as follows. The market price of Marshall Inc. common stock was $ 68 on December 31, 20Y2. Marshall Inc. Comparative Retained Earnings Statement For the Years Ended December 31, 20Y2 and 20Y1 2012 20Y1 Retained earnings, January 1 $ 1,190,000 $ 1,407,900 330,000 Net income 243,700 Total...
 this is ONE problem
Ch 17-3 Exercises and Problems Measures of liquidity, Solvency, and Profitability The comparative financial statements of Marshall Inc. are as follows. The market price of Marshall common stock was $59 on December 31, 20Y2. 2011 Marshall Inc. Comparative Retained Earnings Statement For the Years Ended December 31, 20Y2 and 2041 2012 Retained earnings, January 1 $3,102,250 Net income 691,200 Total $3,793,450 Dividends: On preferred stock $9,100 On common stock 66,600 Total dividends $75,700 Retained earnings, December...
this is ONE problem
Ch 17-3 Exercises and Problems Measures of liquidity, Solvency, and Profitability The comparative financial statements of Marshall Inc. are as follows. The market price of Marshall common stock was $59 on December 31, 20Y2. 2011 Marshall Inc. Comparative Retained Earnings Statement For the Years Ended December 31, 20Y2 and 2041 2012 Retained earnings, January 1 $3,102,250 Net income 691,200 Total $3,793,450 Dividends: On preferred stock $9,100 On common stock 66,600 Total dividends $75,700 Retained earnings, December...
 CengageNuwv2 Unline teachin X The comparative financial State X + € C → Apps v2.cengagenow.com/ilm/take Assignment/take AssignmentMain.do?invoker=&takeAssign Soundcloud World Class I Bills in Google Docs Make APA Document.docx God 1. Working capital 1,199,366 2. Current ratio 3. Quick ratio 4. Accounts receivable turnover 5.9 5. Number of days' sales in receivables 61.9 days 6. Inventory turnover 7. Number of days sales in inventory 121.7 days 8. Ratio of fixed assets to long-term liabilities 0. 97 9. Ratio of liabilities to...
 Measures of liquidity, Solvency and Profitability The comparative financial statements of Marshall Inc. are as follows. The market price of Marshall Inc, common stock was $ 54 on December 31, 2012. Marshall Inc. Comparative Retained Earnings Statement For the Years Ended December 31, 2012 and 2041 2012 2011 Retained earnings, January 1 $ 1,028,100 $ 870,100 Net income 224,000 178,200 Total $ 1,252,100 $ 1,048,300 $ 7.700 $ 7,700 Dividends On preferred stock On common stock Total dividends Retained earnings,...
Most questions answered within 3 hours.
-
Where is the error in this code sequence?
String s1 = "Hello";
String s2 = "ello";...
asked 10 months ago -
Financial data for Joel de Paris, Inc., for last year
follow:
Joel de Paris, Inc.
Balance...
asked 10 months ago -
Consider this reaction:
Al2(SO4)3 (aq)+ BaCl3
(aq) Al2Cl6 (aq)- +
3BaSO4(s) . What is the...
asked 10 months ago -
Suppose that Savneet is considering increasing her
recent random sample from 20 car rentals to 40...
asked 10 months ago -
Trucks arrive at an unloading terminal at an average rate of 120
per hour.
Trucks arrive...
asked 10 months ago -
Why are methanol and ethanol completely soluble in water while
octanol is not very little soluble....
asked 10 months ago -
A facilities manager at a university reads in a research report
that the mean amount of...
asked 10 months ago -
When the CuSO4 is rehydrated by adding water to the anhydrous
compound, is this an endothermic...
asked 10 months ago -
A ray of sunlight is passing from diamond into crown glass; the
angle of incidence is...
asked 10 months ago -
A block of mass 0.249 kg is placed on top of a light, vertical
spring of...
asked 10 months ago -
how do the kidneys compensate in the presences of acidosis
a) trigger hyperventilate
b) reserve acid...
asked 10 months ago -
Question 501 pts
The rental rate of capital to the firm increases. Which of the
following...
asked 10 months ago