
Homework Answers
First find the mean of X and Y & regression coefficient
then find the regression equation

Add Answer to:
For the data set below (a) Determine the least-squares regression line. (b) Graph the least-squares regression...
For the data set below, (a) Determine the least-squares regression line. (b) Graph the least-squares regression...
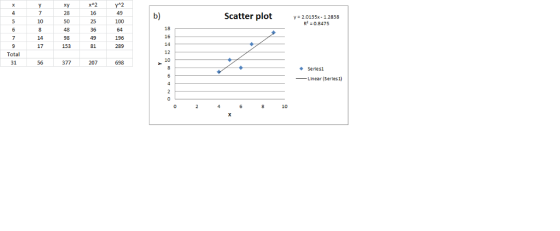
 For the data set below, (a) Determine the least-squares regression line. (b) Graph the least-squares regression line on the scatter diagram. 6 7 y 7 10 8 14 17 (a) Determine the least-squares regression line. (Round to four decimal places as needed.)
For the data set below (a) Determine the least-squares regression line. (b) Compute the sum of...
 For the data set below (a) Determine the least-squares regression line. (b) Compute the sum of the squared residuals for the least-squares regression line. x 30 40 50 60 70 y 80 73 64 48 43 (a) Determine the least-squares regression line. ỳ-Ux + ] (Round to four decimal places as needed.) (b) The sum of the squared residuals is (Round to two decimal places as needed.)
For the data set below, (a) Determine the least-squares regression line. (b) Compute the sum of...
For the data set below, (a) Determine the least-squares regression line. (b) Compute the sum of the squared residuals for the least-squares regression line. x 10 20 30 40 50 y 150 131 135 120 119 (a) Determine the least-squares regression line. ModifyingAbove y with caretyequals=nothingxplus+nothing (Round to four decimal places as needed.)
For the data set below (a) Determine the least-squares regression line. (b) Compute th x30405060 70...
 For the data set below (a) Determine the least-squares regression line. (b) Compute th x30405060 70 y 113 100 87 85 67 (a) Determine the least-squares regression line (Round to four decimal places as needed)
Next Question Question Help The scatter diagram for the data set below is shown. (a) Determine...
 Next Question Question Help The scatter diagram for the data set below is shown. (a) Determine the least-squares regression line. (b) Graph the least-squares regression line on the scatter diagram. X y 0 7.1 0 5.8 7 5.2 4.8 3.7 Pra (a) 9 = x+ (Round to three decimal places as needed.) (b) Choose the correct graph of the least-squares regression line below. Mic OB Ос. Q Pra 1 X Fir SG Click to select your answer(s).
A data set is given below. (a) Draw a scatter diagram. Comment on the type of...
 A data set is given below. (a) Draw a scatter diagram. Comment on the type of relation that appears to exist between x and y (b) Given that x = 3.5000, -2.3452, y = 4.2000, - 1.6625, and r = -0.9387, determine the least squares regression line. (c) Graph the least squares regression line on the scatter diagram drawn in part(a) 0 2 3 4 6 6 5.8 5.8 5.3 3.7 22 2.4 (a) Choose the correct graph below. There...
A data set is given below. (a) Draw a scatter diagram. Comment on the type of...
 A data set is given below. (a) Draw a scatter diagram. Comment on the type of relation that appears to exist between x and y (b) Given that x = 3.5000, 5x = 2.2583, y = 3.8667, 5y = 1.8822, and r= -0.9552, determine the least-squares regression line (c) Graph the least-squares regression line on the scatter diagram drawn in part (a). 1 1 3 4 6 6 5.0 6.4 4.9 3.3 1.6 2.0 у (a) Choose the correct graph...
Compute the least-squares regression equation for the given data set. Round the slope and y-intercept to...
 Compute the least-squares regression equation for the given data set. Round the slope and y-intercept to at least four decimal places. х 3 7 5 4 y اقتها 1 6 4 5 Send data alle Regression line equation: y
6) Compute the least-squares regression line for predicting y from x given the following summary statistics....
6) Compute the least-squares regression line for predicting y from x given the following summary statistics. Round the slope and y -intercept to at least four decimal places. = x 8.8 = s x 1.2 = y 30.4 = s y 16 = r 0.60 Send data to Excel Regression line equation: = y 7)Compute the least-squares regression equation for the given data set. Use a TI- 84 calculator. Round the slope and y -intercept to at least four decimal...
A data set is given below.
 A data set is given below.(a) Draw a scatter diagram. Comment on the type of relation that appears to exist between x and y.(b) Given that x̅=3.6667, sX=2.2509, y̅=3.8000, sy=1.8612, and r=-0.9548, determine the least-squares regression line.(c) Graph the least-squares regression line on the scatter diagram drawn in part (a).x114466y5.16.54.23.41.71.9a.b.
 For the data set below, (a) Determine the least-squares regression line. (b) Graph the least-squares regression line on the scatter diagram. 6 7 y 7 10 8 14 17 (a) Determine the least-squares regression line. (Round to four decimal places as needed.)
 For the data set below (a) Determine the least-squares regression line. (b) Compute the sum of the squared residuals for the least-squares regression line. x 30 40 50 60 70 y 80 73 64 48 43 (a) Determine the least-squares regression line. ỳ-Ux + ] (Round to four decimal places as needed.) (b) The sum of the squared residuals is (Round to two decimal places as needed.)
 For the data set below (a) Determine the least-squares regression line. (b) Compute th x30405060 70 y 113 100 87 85 67 (a) Determine the least-squares regression line (Round to four decimal places as needed)
 Next Question Question Help The scatter diagram for the data set below is shown. (a) Determine the least-squares regression line. (b) Graph the least-squares regression line on the scatter diagram. X y 0 7.1 0 5.8 7 5.2 4.8 3.7 Pra (a) 9 = x+ (Round to three decimal places as needed.) (b) Choose the correct graph of the least-squares regression line below. Mic OB Ос. Q Pra 1 X Fir SG Click to select your answer(s).
 A data set is given below. (a) Draw a scatter diagram. Comment on the type of relation that appears to exist between x and y (b) Given that x = 3.5000, -2.3452, y = 4.2000, - 1.6625, and r = -0.9387, determine the least squares regression line. (c) Graph the least squares regression line on the scatter diagram drawn in part(a) 0 2 3 4 6 6 5.8 5.8 5.3 3.7 22 2.4 (a) Choose the correct graph below. There...
 A data set is given below. (a) Draw a scatter diagram. Comment on the type of relation that appears to exist between x and y (b) Given that x = 3.5000, 5x = 2.2583, y = 3.8667, 5y = 1.8822, and r= -0.9552, determine the least-squares regression line (c) Graph the least-squares regression line on the scatter diagram drawn in part (a). 1 1 3 4 6 6 5.0 6.4 4.9 3.3 1.6 2.0 у (a) Choose the correct graph...
 Compute the least-squares regression equation for the given data set. Round the slope and y-intercept to at least four decimal places. х 3 7 5 4 y اقتها 1 6 4 5 Send data alle Regression line equation: y
 A data set is given below.(a) Draw a scatter diagram. Comment on the type of relation that appears to exist between x and y.(b) Given that x̅=3.6667, sX=2.2509, y̅=3.8000, sy=1.8612, and r=-0.9548, determine the least-squares regression line.(c) Graph the least-squares regression line on the scatter diagram drawn in part (a).x114466y5.16.54.23.41.71.9a.b.
Most questions answered within 3 hours.
-
Where is the error in this code sequence?
String s1 = "Hello";
String s2 = "ello";...
asked 11 months ago -
Financial data for Joel de Paris, Inc., for last year
follow:
Joel de Paris, Inc.
Balance...
asked 11 months ago -
Consider this reaction:
Al2(SO4)3 (aq)+ BaCl3
(aq) Al2Cl6 (aq)- +
3BaSO4(s) . What is the...
asked 11 months ago -
Suppose that Savneet is considering increasing her
recent random sample from 20 car rentals to 40...
asked 11 months ago -
Trucks arrive at an unloading terminal at an average rate of 120
per hour.
Trucks arrive...
asked 11 months ago -
Why are methanol and ethanol completely soluble in water while
octanol is not very little soluble....
asked 11 months ago -
A facilities manager at a university reads in a research report
that the mean amount of...
asked 11 months ago -
When the CuSO4 is rehydrated by adding water to the anhydrous
compound, is this an endothermic...
asked 11 months ago -
A ray of sunlight is passing from diamond into crown glass; the
angle of incidence is...
asked 11 months ago -
A block of mass 0.249 kg is placed on top of a light, vertical
spring of...
asked 11 months ago -
how do the kidneys compensate in the presences of acidosis
a) trigger hyperventilate
b) reserve acid...
asked 11 months ago -
Question 501 pts
The rental rate of capital to the firm increases. Which of the
following...
asked 11 months ago