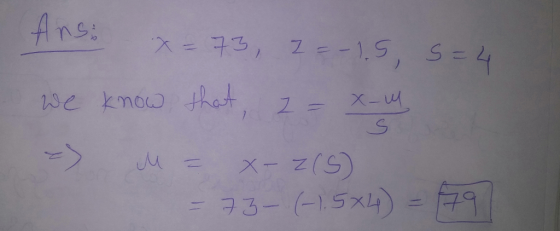
a final exam test score of 73 was transformed into a standard score of -1.5 ....
Homework Answers
Add Answer to:
a
final exam test score of 73 was transformed into a standard score
of -1.5 ....
A final exam in Math 160 has a mean of 73 with standard deviation 7.73
A final exam in Math 160 has a mean of 73 with standard deviation 7.73. Assume that a random sample of 24 students is selected and the test score of the sample is computed. Assuming the scores are normally distributed, what percentage of sample means are less than 69?
IQ-scores are standard-score transformed scores having a mean of 100 and a standard deviation of 15;...
IQ-scores are standard-score transformed scores having a mean of 100 and a standard deviation of 15; SAT scores are standard-score transformed scores having a mean of 500 and a standard deviation of 100. In what follows, X refers to a raw score from a distribution with a mean of X and a standard deviation of S, and SAT and IQ refer to the corresponding transform of that score. Solve for the missing value in each of the following: (a) X=-2.5;Xmean=...
7) A retired statistics professor has recorded final exam results for decades. The mean final exam...
7) A retired statistics professor has recorded final exam results for decades. The mean final exam score for the population of her students is 82.4 with a standard deviation of 6.5 . In the last year, her standard deviation seems to have changed. She bases this on a random sample of 25 students whose final exam scores had a mean of 80 with a standard deviation of 4.2 . Test the professor's claim that the current standard deviation is different...
A recent statistics exam given had a mean score of 73% with s standard deviation of...
A recent statistics exam given had a mean score of 73% with s standard deviation of 17.4. If your score on that exam was 88%, what is your z-score? Provide the z-score and explain what it means in this situation.
1. A student receives test scores of 62, 83, and 91. The student’s final exam score...
1. A student receives test scores of 62, 83, and 91. The student’s final exam score is 88 and homework score is 76. Each test is worth 20% of the final grade, the final exam is 25% of the final grade and the homework grade is 15% of the final grade. What is the student’s mean score in the class?
Raw scores on behavioral tests are often transformed for easier comparison. A test of reading ability...
Raw scores on behavioral tests are often transformed for easier comparison. A test of reading ability has mean 69 and standard deviation 10 when given to third graders. Sixth graders have mean score 77 and standard deviation 7 on the same test. To provide separate "norms" for each grade, we want scores in each grade to have mean 100 and standard deviation 20. (Round your answers to two decimal places.) What linear transformation will change third-grade scores x into new...
Raw scores on behavioral tests are often transformed for easier comparison. A test of reading ability...
Raw scores on behavioral tests are often transformed for easier comparison. A test of reading ability has mean 60 and standard deviation 10 when given to third graders. Sixth graders have mean score 83 and standard deviation 9 on the same test. To provide separate "norms" for each grade, we want scores in each grade to have mean 100 and standard deviation 20. (Round your answers to two decimal places.) (a) What linear transformation will change third-grade scores x into new...
3. A normal distribution of BMCC MATSI scores has a standard deviation of 1.5. Find the...
 3. A normal distribution of BMCC MATSI scores has a standard deviation of 1.5. Find the z-scores corresponding to each of the following values: a. A score that is 3 points above the mean. b. A score that is 1.5 points below the mean. c. A score that is 2.25 points above the mean 4. Scores on BMCC fall 2017 MATI50.5 department final exam form a normal distribution with a mean of 70 and a standard deviation of 8. What...
-which of these is an advantage of using a transformed score when reporting the score of...
-which of these is an advantage of using a transformed score when reporting the score of an individual case? Transformed scores will be reported on the nominal level. Transformed scores will allow the mean score to be reported. Transformed scores provide a measure of variability. Transformed scores provide a context for the individual's score -Which of these would be considered a transformed score? percentile ranks and t scores t scores z scores and percentile ranks z scores -If Elliot collects...
. Consider the following scores on a final exam. Emma 85 Noah 90 Olivia 95 Mason...
. Consider the following scores on a final exam. Emma 85 Noah 90 Olivia 95 Mason 87 Liam 88 Sophia 94 Isabella 92 Ethan 95 James 92 Charlotte 91 3a. What is the mean test score? 3b. What is the standard deviation of the test scores? 3c. Compare the standard deviation and coefficient of variance from the Mid-Term Exam (problem 2) to the standard deviation and coefficient of variance from the Final Exam. What does this tell you about the...
 3. A normal distribution of BMCC MATSI scores has a standard deviation of 1.5. Find the z-scores corresponding to each of the following values: a. A score that is 3 points above the mean. b. A score that is 1.5 points below the mean. c. A score that is 2.25 points above the mean 4. Scores on BMCC fall 2017 MATI50.5 department final exam form a normal distribution with a mean of 70 and a standard deviation of 8. What...
Most questions answered within 3 hours.
-
Where is the error in this code sequence?
String s1 = "Hello";
String s2 = "ello";...
asked 11 months ago -
Financial data for Joel de Paris, Inc., for last year
follow:
Joel de Paris, Inc.
Balance...
asked 11 months ago -
Consider this reaction:
Al2(SO4)3 (aq)+ BaCl3
(aq) Al2Cl6 (aq)- +
3BaSO4(s) . What is the...
asked 11 months ago -
Suppose that Savneet is considering increasing her
recent random sample from 20 car rentals to 40...
asked 11 months ago -
Trucks arrive at an unloading terminal at an average rate of 120
per hour.
Trucks arrive...
asked 11 months ago -
Why are methanol and ethanol completely soluble in water while
octanol is not very little soluble....
asked 11 months ago -
A facilities manager at a university reads in a research report
that the mean amount of...
asked 11 months ago -
When the CuSO4 is rehydrated by adding water to the anhydrous
compound, is this an endothermic...
asked 11 months ago -
A ray of sunlight is passing from diamond into crown glass; the
angle of incidence is...
asked 11 months ago -
A block of mass 0.249 kg is placed on top of a light, vertical
spring of...
asked 11 months ago -
how do the kidneys compensate in the presences of acidosis
a) trigger hyperventilate
b) reserve acid...
asked 11 months ago -
Question 501 pts
The rental rate of capital to the firm increases. Which of the
following...
asked 11 months ago