
Homework Answers
Solution:
Given: Scores on the Math portion of the SAT are believed to be
Normally distributed and range from 200 to 800.
c = confidence level = 90%
Margin of Error = E = 23
We have to find sample size n.

Population standard deviation  is not given, but we can estimate it using Range.


and
Zc is z critical value for c = 90% confidence level.
Find Area = ( 1 + c ) / 2 = ( 1 + 0.90) / 2 = 1.90 / 2 = 0.9500
Look in z table for Area = 0.9500 or its closest area and find corresponding z value.
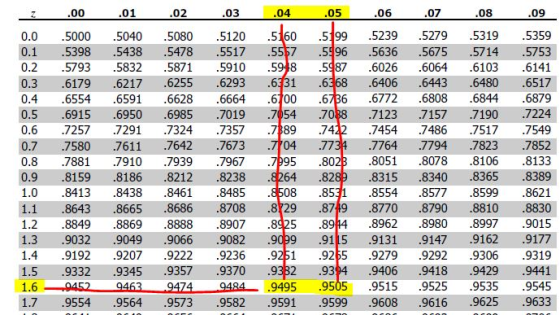
Area 0.9500 is in between 0.9495 and 0.9505 and both the area are at same distance from 0.9500
Thus we look for both area and find both z values
Thus Area 0.9495 corresponds to 1.64 and 0.9505 corresponds to 1.65
Thus average of both z values is : ( 1.64+1.65) / 2 = 1.645
Thus Zc = 1.645
Thus


( Sample size is always rounded up)
Add Answer to:
The SAT is the most widely used test in the undergraduate admissions process. Scores on the...
The SAT is the most widely used test in the undergraduate admissions process. Scores on the...
 The SAT is the most widely used test in the undergraduate admissions process. Scores on the math portion of the SAT are believed to be normally distributed and range from 200 to 800. A researcher from the admissions department at the University of New Hampshire is interested in estimating the mean math SAT scores of the incoming class with 90% confidence. How large a sample should she take to ensure that the margin of error is below 20? (You may...
a. The SAT is the most widely used test in the undergraduate admissions process. Scores on...
a. The SAT is the most widely used test in the undergraduate admissions process. Scores on the math portion of the SAT are believed to be normally distributed and range from 200 to 800. A researcher from the admissions department at the University of New Hampshire is interested in estimating the mean math SAT scores of the incoming class with 95% confidence. How large a sample should she take to ensure that the margin of error is below 32? Round...
The SAT is the most widely used college admission exam. (Most community colleges do not require...
The SAT is the most widely used college admission exam. (Most community colleges do not require students to take this exam.) The mean SAT math score varies by state and by year, so the value of µ depends on the state and the year. But let’s assume that the shape and spread of the distribution of individual SAT math scores in each state is the same each year. More specifically, assume that individual SAT math scores consistently have a normal...
The admissions officer at a small college compares the scores on the Scholastic Aptitude Test (SAT)...
The admissions officer at a small college compares the scores on the Scholastic Aptitude Test (SAT) for the school's male and female applicants. A random sample of 12 male applicants results in a SAT scoring mean of 1053 with a standard deviation of 30. A random sample of 18 female applicants results in a SAT scoring mean of 1155 with a standard deviation of 42. Using this data, find the 90% confidence interval for the true mean difference between the...
The admissions officer at a small college compares the scores on the Scholastic Aptitude Test (SAT)...
The admissions officer at a small college compares the scores on the Scholastic Aptitude Test (SAT) for the school's in-state and out-of-state applicants. A random sample of 8 in-state applicants results in a SAT scoring mean of 1106 with a standard deviation of 57. A random sample of 18 out-of-state applicants results in a SAT scoring mean of 1073 with a standard deviation of 47. Using this data, find the 90% confidence interval for the true mean difference between the...
ROUND to 3 decimal places Type numbers in the boxes. Estimating Mean SAT Math Score ay...
 ROUND to 3 decimal places
Type numbers in the boxes. Estimating Mean SAT Math Score ay Part 1: 5 points The SAT is the most widely used college admission exam. (Most community ay Part 2: 5 points colleges do not require students to take this exam.) The mean SAT math score varies by state and by year, so the value of u depends on the state and the year. 10 points But let's assume that the shape and spread of...
ROUND to 3 decimal places
Type numbers in the boxes. Estimating Mean SAT Math Score ay Part 1: 5 points The SAT is the most widely used college admission exam. (Most community ay Part 2: 5 points colleges do not require students to take this exam.) The mean SAT math score varies by state and by year, so the value of u depends on the state and the year. 10 points But let's assume that the shape and spread of...
SAT scores: A college admissions officer sampled 108 entering freshmen and found that 34 of them...
 SAT scores: A college admissions officer sampled 108 entering freshmen and found that 34 of them scored less than 600 on the math SAT. Part: 0/3 Part 1 of 3 (a) Find a point estimate for the proportion of all entering freshmen at this college who scored less than 600 on the math SAT. Round the answer to at least three decimal places. The point estimate for the proportion of all entering freshmen at this college who scored less than...
The admissions officer at a small college compares the scores on the Scholastic Aptitude Test (SAT)...
The admissions officer at a small college compares the scores on the Scholastic Aptitude Test (SAT) for the school's in-state and out-of-state applicants. A random sample of 19 in-state applicants results in a SAT scoring mean of 1228 with a standard deviation of 39. A random sample of 11 out-of-state applicants results in a SAT scoring mean of 1168 with a standard deviation of 31. Using this data, find the 80% confidence interval for the true mean difference between the...
Scores on the math SAT are normally distributed. A sample of 20 SAT scores had standard...
Scores on the math SAT are normally distributed. A sample of 20 SAT scores had standard deviation s = 86. Construct a 98% confidence interval for the population standard deviation σ. Round the answers to two decimal places. The 98% confidence interval is
The admissions officer at a small college compares the scores on the Scholastic Aptitude Test (SAT)...
The admissions officer at a small college compares the scores on the Scholastic Aptitude Test (SAT) for the school's male and female applicants. A random sample of 15 male applicants results in a SAT scoring mean of 1042 with a standard deviation of 60. A random sample of 7 female applicants results in a SAT scoring mean of 1142 with a standard deviation of 43. Using this data, find the 95% confidence interval for the true mean difference between the...
 The SAT is the most widely used test in the undergraduate admissions process. Scores on the math portion of the SAT are believed to be normally distributed and range from 200 to 800. A researcher from the admissions department at the University of New Hampshire is interested in estimating the mean math SAT scores of the incoming class with 90% confidence. How large a sample should she take to ensure that the margin of error is below 20? (You may...
 ROUND to 3 decimal places
Type numbers in the boxes. Estimating Mean SAT Math Score ay Part 1: 5 points The SAT is the most widely used college admission exam. (Most community ay Part 2: 5 points colleges do not require students to take this exam.) The mean SAT math score varies by state and by year, so the value of u depends on the state and the year. 10 points But let's assume that the shape and spread of...
ROUND to 3 decimal places
Type numbers in the boxes. Estimating Mean SAT Math Score ay Part 1: 5 points The SAT is the most widely used college admission exam. (Most community ay Part 2: 5 points colleges do not require students to take this exam.) The mean SAT math score varies by state and by year, so the value of u depends on the state and the year. 10 points But let's assume that the shape and spread of...
 SAT scores: A college admissions officer sampled 108 entering freshmen and found that 34 of them scored less than 600 on the math SAT. Part: 0/3 Part 1 of 3 (a) Find a point estimate for the proportion of all entering freshmen at this college who scored less than 600 on the math SAT. Round the answer to at least three decimal places. The point estimate for the proportion of all entering freshmen at this college who scored less than...
Most questions answered within 3 hours.
-
Where is the error in this code sequence?
String s1 = "Hello";
String s2 = "ello";...
asked 11 months ago -
Financial data for Joel de Paris, Inc., for last year
follow:
Joel de Paris, Inc.
Balance...
asked 11 months ago -
Consider this reaction:
Al2(SO4)3 (aq)+ BaCl3
(aq) Al2Cl6 (aq)- +
3BaSO4(s) . What is the...
asked 11 months ago -
Suppose that Savneet is considering increasing her
recent random sample from 20 car rentals to 40...
asked 11 months ago -
Trucks arrive at an unloading terminal at an average rate of 120
per hour.
Trucks arrive...
asked 11 months ago -
Why are methanol and ethanol completely soluble in water while
octanol is not very little soluble....
asked 11 months ago -
A facilities manager at a university reads in a research report
that the mean amount of...
asked 11 months ago -
When the CuSO4 is rehydrated by adding water to the anhydrous
compound, is this an endothermic...
asked 11 months ago -
A ray of sunlight is passing from diamond into crown glass; the
angle of incidence is...
asked 11 months ago -
A block of mass 0.249 kg is placed on top of a light, vertical
spring of...
asked 11 months ago -
how do the kidneys compensate in the presences of acidosis
a) trigger hyperventilate
b) reserve acid...
asked 11 months ago -
Question 501 pts
The rental rate of capital to the firm increases. Which of the
following...
asked 11 months ago