how do you create a Michealis-Menten plot and a Lineweaver- Burk plot using the equation that is...
how do you create a Michealis-Menten plot and a Lineweaver- Burk plot using the equation that is determine from a calibration curve of absorbance vs. time? How do you convert the absorbance determine into concentration?
Homework Answers
This question is based on Enzyme catalysis which is related to Absorbance and concentration.
Absorbance may be converted into concentration by the formula which is as follows:
A = ɛ.l.c,
where
A = the amount of light which is absorbed by the sample in a given wavelength,
ɛ = the molar absorptivity,
l = that distance which the light travels through the solution,
and
c = concentration of the absorbing species which is measured in per unit volume.
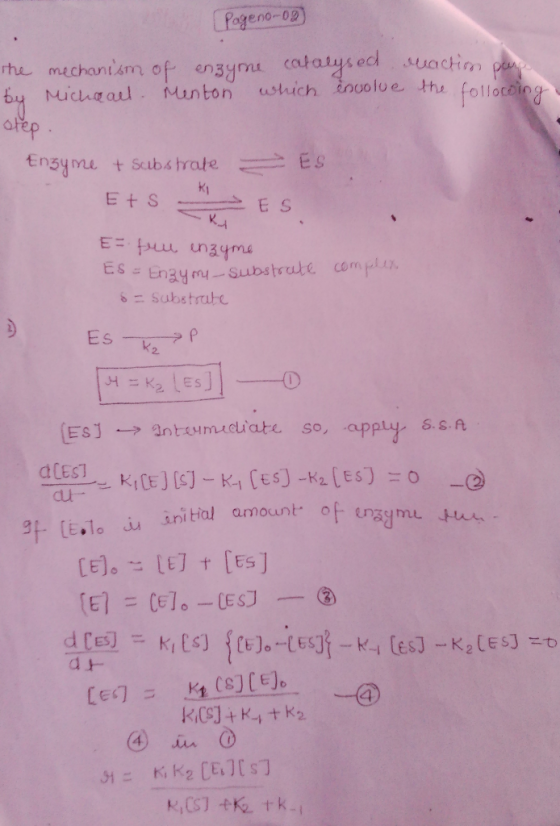
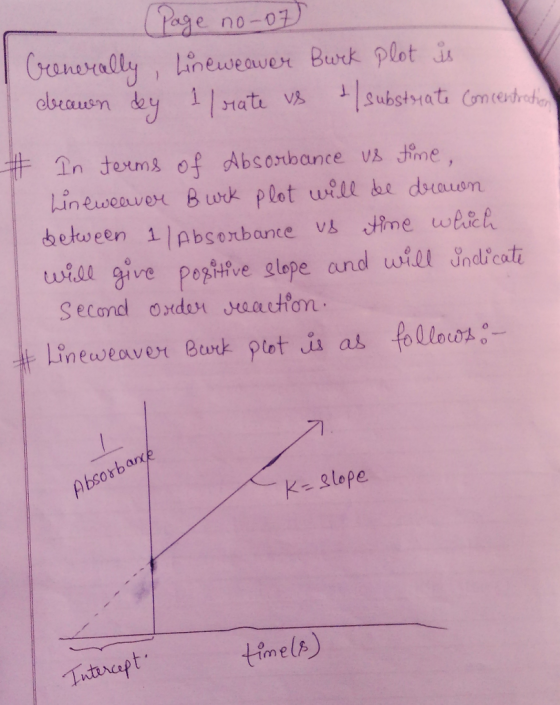
I am giving here all the information about michalis menton plot and lineweaver burk plot in terms of concentration as well as absorbance. Please find it as an image form.
- Absorbance vs. time plot gives a linear plot which indicates the zero order reaction and shows negative slope, that is (k = –slope).
- ln(Absorbance) vs. time plot gives a linear plot which indicates a first order reaction and shows negative slope (k = –slope).
- 1/(Absorbance) vs. time plot gives a linear plot which indicates a second order reaction and give the positive slope.(k = slope).

![no LUT I= (Page no-03 K₂ [F] o [s] [s] + Ky tkz KI K [Eo] [s] [s] tkm. M = m c y (3) 15] + km gеtuр a gum Shweta lounas km =](//img.homeworklib.com/questions/0e1bf0c0-7349-11ea-97de-f541f78e052d.png?x-oss-process=image/resize,w_560)
![(page no-04 K2 [Elo M = ma 2 Imax žuo order Ist order cette [s] Hole veate are some time denoted byrr Different kind of plo](//img.homeworklib.com/questions/0ed1cf10-7349-11ea-a0ec-35a702fc607a.png?x-oss-process=image/resize,w_560)
![(Page no-05] km crmax Amox rs J Km](//img.homeworklib.com/questions/0f81be80-7349-11ea-b758-693ff7f7bc12.png?x-oss-process=image/resize,w_560)


![no LUT I= (Page no-03 K₂ [F] o [s] [s] + Ky tkz KI K [Eo] [s] [s] tkm. M = m c y (3) 15] + km gеtuр a gum Shweta lounas km =](http://img.homeworklib.com/questions/0e1bf0c0-7349-11ea-97de-f541f78e052d.png?x-oss-process=image/resize,w_560)
![(page no-04 K2 [Elo M = ma 2 Imax žuo order Ist order cette [s] Hole veate are some time denoted byrr Different kind of plo](http://img.homeworklib.com/questions/0ed1cf10-7349-11ea-a0ec-35a702fc607a.png?x-oss-process=image/resize,w_560)
![(Page no-05] km crmax Amox rs J Km](http://img.homeworklib.com/questions/0f81be80-7349-11ea-b758-693ff7f7bc12.png?x-oss-process=image/resize,w_560)


Add Answer to:
how do you create a Michealis-Menten plot and a Lineweaver- Burk
plot using the equation that is...
4. The double-reciprocal transformation of the Michaelis-Menten equation, also called the Lineweaver-Burk plot, is give...
 4. The double-reciprocal transformation of the Michaelis-Menten equation, also called the Lineweaver-Burk plot, is given by: 1 Km 1 1 where, the plot of (1/V.) vs (1/[S]) is a linear plot. If you only know the x-axis and y-axis intercepts from this plot, how can you determine Vmax and Km? (A) multiply the reciprocal of the x-axis intercept by -1. (B) multiply the reciprocal of the y-axis intercept by -1. (C) take the reciprocal of the x-axis intercept. (D) take...
(I need help with part C, Drawing the expected Michaelis-Menten plot; Do NOT draw the Lineweaver-Burk...
(I need help with part C, Drawing the expected Michaelis-Menten plot; Do NOT draw the Lineweaver-Burk plot. thanks!) 1. Michaelis-Menten kinetics- use the M-M equation to answer the following: a. An enzyme (5 µM) has a Vmax of 450 mM/min. What is kcat? b. When the substrate concentration is 50 mM, the initial velocity (V0) was measured to be 375 mM/min. Under the conditions described above, calculate the KM. c. Draw the expected Michaelis-Menten plot (label your axes and include...
The equation that describes the above Michaelis-Menten curve: Vo TS]+K Vmax [S] Michaelis-Menten Equation Lineweaver and...
 The equation that describes the above Michaelis-Menten curve: Vo TS]+K Vmax [S] Michaelis-Menten Equation Lineweaver and Burke manipulated the Michaelis-Menten equation to yield: Ko V I S Vmax [S] Lineweaver-Burke Equation Linewenver Burke Equation If you plot 1/ V. vs. 1/[S], you get the following Lineweaver-Burke plot: 1/V. Slope = km/Vmax Intercept = -1/KM -Intercept = 1/Vmax 1/[S] Which is easier to calculate values for Km and Vmax, using the linear (y=mx+b) Lineweaver-Burke Plot or the Michaelis-Menten curve?
o Flipped class: Michaelis-Menten vs. Lineweaver-Burk 10 Essentially, we'll duplicate the error estimates from (A) a...
 o Flipped class: Michaelis-Menten vs. Lineweaver-Burk 10 Essentially, we'll duplicate the error estimates from (A) a nonlinear fit and (B) a nonlinear function transformed into linear form in Matlab. 1) Use Matlab to generate synthetic data obeying the Michaelis-Menten equation i.e. find dP/dt for [S] = 1:20. Add noise to the data (rand or randn or normmd). Use Vmax-1, km-5 2) Plot the data points (dP/dt vs [S]) that you've obtained. Fit the data (model1:- fitnlm(x,y.modelname,jnitialguesses). Output the estimated Vmax...
How do you determine what is a proper Lineweaver-Burk equation? why would a equation such as...
How do you determine what is a proper Lineweaver-Burk equation? why would a equation such as y= 5.04x10^-8x -0.0028 not be considered a proper Lineweaver-burk equation? how would one determine if its a proper LwB equation or not?
What is one major disadvantage of using a Lineweaver-Burk plot for determination of kinetic parameters from...
What is one major disadvantage of using a Lineweaver-Burk plot for determination of kinetic parameters from real data? A.) A Lineweaver-Burk plot biases data with fast initial velocities B.) The Lineweaver-Burk plots tend to be reliant on how reproducible the initial rate is C.) The Lineweaver-Burk plot biases low concentration data D.) all of the above
How can the Michaelis-Menten constant, be derived from this Lineweaver-Burk plot? Vmax O km = (-1)/(x-intercept)...
 How can the Michaelis-Menten constant, be derived from this Lineweaver-Burk plot? Vmax O km = (-1)/(x-intercept) O km = (-1) * (x-intercept) O km = 1/(x-intercept) 0 Km = s;lope
Michaelis-Menten plot and Lineweaver-Burk plot calculations- use provided data to generate both M-M and L-B plots....
 Michaelis-Menten plot and Lineweaver-Burk plot calculations- use provided data to generate both M-M and L-B plots. Use scatter plots with markers on Excel to determine Vinas, KM, kcat, kcat/KM. The total enzyme concentration is 5 μM. Graphs can be 2 page. Must be computer generated with all axes labeled. Substrate (mM Vo (mM/s) 2.73 5.45 8.17 10.9 40.4 0.124 0.181 0.212 0.228 0.303
Where do the numbers come from for a Michaelis-Menton and Lineweaver-Burke Plot? Can you please explain...
 Where do the numbers come from for a Michaelis-Menton and
Lineweaver-Burke Plot? Can you please explain in detail please and
thank you?
Did
an Enzyme lab w/dilutions and recorded absorbances. I am now asked
to construct Michaelis-Menton ans Lineweaver-Burke plots BUT I dont
know if the plot is based on my results from the dilutions and
absorbances.
For your lab reports, you will determine how much sugar was made during your enzyme reactions in Week 2 based on the linear...
Where do the numbers come from for a Michaelis-Menton and
Lineweaver-Burke Plot? Can you please explain in detail please and
thank you?
Did
an Enzyme lab w/dilutions and recorded absorbances. I am now asked
to construct Michaelis-Menton ans Lineweaver-Burke plots BUT I dont
know if the plot is based on my results from the dilutions and
absorbances.
For your lab reports, you will determine how much sugar was made during your enzyme reactions in Week 2 based on the linear...
 4. The double-reciprocal transformation of the Michaelis-Menten equation, also called the Lineweaver-Burk plot, is given by: 1 Km 1 1 where, the plot of (1/V.) vs (1/[S]) is a linear plot. If you only know the x-axis and y-axis intercepts from this plot, how can you determine Vmax and Km? (A) multiply the reciprocal of the x-axis intercept by -1. (B) multiply the reciprocal of the y-axis intercept by -1. (C) take the reciprocal of the x-axis intercept. (D) take...
 The equation that describes the above Michaelis-Menten curve: Vo TS]+K Vmax [S] Michaelis-Menten Equation Lineweaver and Burke manipulated the Michaelis-Menten equation to yield: Ko V I S Vmax [S] Lineweaver-Burke Equation Linewenver Burke Equation If you plot 1/ V. vs. 1/[S], you get the following Lineweaver-Burke plot: 1/V. Slope = km/Vmax Intercept = -1/KM -Intercept = 1/Vmax 1/[S] Which is easier to calculate values for Km and Vmax, using the linear (y=mx+b) Lineweaver-Burke Plot or the Michaelis-Menten curve?
 o Flipped class: Michaelis-Menten vs. Lineweaver-Burk 10 Essentially, we'll duplicate the error estimates from (A) a nonlinear fit and (B) a nonlinear function transformed into linear form in Matlab. 1) Use Matlab to generate synthetic data obeying the Michaelis-Menten equation i.e. find dP/dt for [S] = 1:20. Add noise to the data (rand or randn or normmd). Use Vmax-1, km-5 2) Plot the data points (dP/dt vs [S]) that you've obtained. Fit the data (model1:- fitnlm(x,y.modelname,jnitialguesses). Output the estimated Vmax...
 How can the Michaelis-Menten constant, be derived from this Lineweaver-Burk plot? Vmax O km = (-1)/(x-intercept) O km = (-1) * (x-intercept) O km = 1/(x-intercept) 0 Km = s;lope
 Michaelis-Menten plot and Lineweaver-Burk plot calculations- use provided data to generate both M-M and L-B plots. Use scatter plots with markers on Excel to determine Vinas, KM, kcat, kcat/KM. The total enzyme concentration is 5 μM. Graphs can be 2 page. Must be computer generated with all axes labeled. Substrate (mM Vo (mM/s) 2.73 5.45 8.17 10.9 40.4 0.124 0.181 0.212 0.228 0.303
 Where do the numbers come from for a Michaelis-Menton and
Lineweaver-Burke Plot? Can you please explain in detail please and
thank you?
Did
an Enzyme lab w/dilutions and recorded absorbances. I am now asked
to construct Michaelis-Menton ans Lineweaver-Burke plots BUT I dont
know if the plot is based on my results from the dilutions and
absorbances.
For your lab reports, you will determine how much sugar was made during your enzyme reactions in Week 2 based on the linear...
Where do the numbers come from for a Michaelis-Menton and
Lineweaver-Burke Plot? Can you please explain in detail please and
thank you?
Did
an Enzyme lab w/dilutions and recorded absorbances. I am now asked
to construct Michaelis-Menton ans Lineweaver-Burke plots BUT I dont
know if the plot is based on my results from the dilutions and
absorbances.
For your lab reports, you will determine how much sugar was made during your enzyme reactions in Week 2 based on the linear...
Most questions answered within 3 hours.
-
Where is the error in this code sequence?
String s1 = "Hello";
String s2 = "ello";...
asked 10 months ago -
Financial data for Joel de Paris, Inc., for last year
follow:
Joel de Paris, Inc.
Balance...
asked 10 months ago -
Consider this reaction:
Al2(SO4)3 (aq)+ BaCl3
(aq) Al2Cl6 (aq)- +
3BaSO4(s) . What is the...
asked 10 months ago -
Suppose that Savneet is considering increasing her
recent random sample from 20 car rentals to 40...
asked 10 months ago -
Trucks arrive at an unloading terminal at an average rate of 120
per hour.
Trucks arrive...
asked 10 months ago -
Why are methanol and ethanol completely soluble in water while
octanol is not very little soluble....
asked 10 months ago -
A facilities manager at a university reads in a research report
that the mean amount of...
asked 10 months ago -
When the CuSO4 is rehydrated by adding water to the anhydrous
compound, is this an endothermic...
asked 10 months ago -
A ray of sunlight is passing from diamond into crown glass; the
angle of incidence is...
asked 10 months ago -
A block of mass 0.249 kg is placed on top of a light, vertical
spring of...
asked 10 months ago -
how do the kidneys compensate in the presences of acidosis
a) trigger hyperventilate
b) reserve acid...
asked 10 months ago -
Question 501 pts
The rental rate of capital to the firm increases. Which of the
following...
asked 10 months ago