Show the derivation of the IS curve. Clearly label your graphs.
Show the derivation of the IS curve. Clearly label your graphs.
Homework Answers
Derivation and properties of IS explained with the help of suitable diagrams:
The goods market equilibrium schedule is the IS curve (schedule). It shows combination of interest rates and levels of output such that planned (desired) spending (expenditure) equals income. The goods-market equilibrium schedule is a simple extension of income determination with a 45° line diagram (of the Keynesian type). Now, investment is no longer fully exogenous, but is also determined by the rate of interest (which is a policy variable).
Figure 3 shows a typical investment (demand) schedule. It shows the planned level of investment (spending) at each rate of interest. Since higher rates of interest reduce the profitability of additions to the capital stock, higher interest rates of imply lower planned rates of investment spending. (Changes in autonomous investment shift the investment schedule).
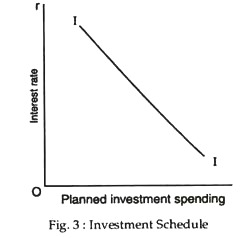
The investment function is expressed as: I = I̅ – cr, C<0, where r is the rate of interest and c measures the interest response of investment, I̅ denotes autonomous investment, that is, investment spending which is independent of both income and the rate of interest. The investment function above states that the lower the interest rate, the higher is planned investment, with the coefficient c measuring the responsiveness of investment spending to the interest rate.
The IS Curve:
Figure 4 shows how the IS curve is derived. At an interest rate, r1, equilibrium in the goods market is at point E in the upper part with an income level or Y1. In the lower part of the diagram this is recorded as point E’.

Now a fall in the interest rate to r2 raises aggregate demand increasing the level of spending at each income level. The new equilibrium level of income is Y2. In the lower part, point F shows the new equilibrium in the goods corresponding to an interest rate r2.
Definition:
The IS curve is a locus of points showing alternative combinations of interest rates and income (output) at which the goods market clears. That is why the IS curve is called the goods market equilibrium schedule.
Properties:
We can gain further insight into the IS curve by raising and answering the following questions:
1. What determines the slope of the IS curve?
2. What determines the position of the IS curve, given its slope, and what causes the curve to shift?
3. What happens when the interest rate and income are at levels such that we are off the IS curve?
The Slope of the IS Curve
The IS curve is negatively sloped, because a higher level of the interest rate reduces investment spending, thereby reducing aggregate demand and thus the equilibrium level of income. The steepness of the curve depends on the interest elasticity of investment (i.e., how sensitive investment spending is to changes in the interest rate) as also on the (investment).
Position off the IS Curve:
Figure 5 is just a reproduction of Fig. 4(b), along with two additional points — the disequilibrium points G and H. At point G national income is the same as at E, but the rate of interest is lower (r2). Consequently, the demand for investment is higher than that at E, and the demand for goods is also higher than that at E.
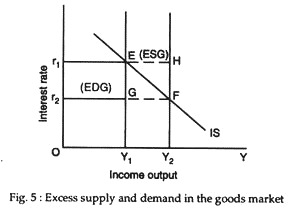
This simply means that the demand for goods must exceed the level of output, and so there is an excess demand for goods. Likewise, at point H, the rate of interest is higher than at F, but the demand for goods is lower than at F, and there is excess supply of goods.
Thus, Fig. 5 clearly shows that points above and to the right of the IS curve- points like H—are points of excess supply of goods (ESG). By contrast points below and to the left of the IS curve are points of excess demand for goods (EDG). At a point like G, for instance, the interest rate is too low and aggregate demand too high relative to output.
Major Points:
The major points about the IS curve are the following:
1. The IS curve is the schedule of combinations of the interest rate and the level of income such that the goods market is in equilibrium.
2 The IS curve is negatively sloped because an increase in the interest rate reduces planned (desired) investment spending and therefore reduces aggregate demand, thereby lowering the equilibrium level of income.
3. The smaller the investment multiplier and the less sensitive investment spending is to interest rate changes, the steeper is the IS curve.
4. The IS curve is shifted by changes in autonomous spending. An increase in autonomous spending, such as investment spending or government expenditure shifts the IS curve to the right.
5. At points to the right of the IS curve, there is excess supply in the goods market, at points to the left of the curve, there is excess demand for goods.
< Question 17 of 27 > The graphs show a titration curve for the amino acid...
 < Question 17 of 27 > The graphs show a titration curve for the amino acid histidine. Label the fist curve with the major histidine species at each position. One histidine species will not be used. Label the second curve with the pK, values for the histidine functional groups and the isoelectric point (pl) of histidine. Answer Bank [Hisºj - [His") [ His* 1 - (His 15 20 25 30 IOH equivalents)
Instructions: In group of 2 or 3 students, discuss the following problems. Graph a D or S curve for each of the situations below and clearly show if there is a movement or shift of the curve. If ther...
 Instructions: In group of 2 or 3 students, discuss the following problems. Graph a D or S curve for each of the situations below and clearly show if there is a movement or shift of the curve. If there is a shift of the curve, write below the graph the factor shifting the curve. Clearly label your graphs and indicate the factor shifting the curves, 13. Suppose the demand and supply for milk are described by the following equations: Q...
3. Deriving the IS Curve: Use an income/spending graph and IS curve graph to show the...
3. Deriving the IS Curve: Use an income/spending graph and IS curve graph to show the shortrun impact of an increase in the interest rate on output in the goods market. Include a brief explanation in your answer and be sure to properly label your graphs. 4. Shifting the IS Curve: Use an income/spending graph and IS curve graph to show the shortrun impact of an increase in autonomous investment on output in the goods market. Include a brief explanation...
Show the effects of a decrease in nominal income on the interest rate. Clearly label your...
 Show the effects of a decrease in nominal income on the interest
rate. Clearly label your graph.
Money Supply MS Money Demand Md Money, AM
Show the effects of a decrease in nominal income on the interest
rate. Clearly label your graph.
Money Supply MS Money Demand Md Money, AM
Know how to label 4 of the graphs (circular flow diagram, Phillips curve, business cycle ,...
Know how to label 4 of the graphs (circular flow diagram, Phillips curve, business cycle , loanable funds model)
Show the effects of a decrease in autonomous spending on output. Clearly label your graph Production...
 Show the effects of a decrease in autonomous spending on output.
Clearly label your graph
Production Slope = 1 Demand Slope = c1 Equilibrium Point: Y=Z Autonomous Spending 5 45° Income, Y
Show the effects of a decrease in autonomous spending on output.
Clearly label your graph
Production Slope = 1 Demand Slope = c1 Equilibrium Point: Y=Z Autonomous Spending 5 45° Income, Y
For all of your graphs, be sure to label the axes and clearly denote equilibrium prices...
For all of your graphs, be sure to label the axes and clearly denote equilibrium prices and quantities. The first 3 are 2 point questions In the portfolio choice model, depict graphically the effect of a decrease in wealth. What happens to the equilibrium price of bonds and the equilibrium interest rate? 3-4. In the portfolio choice model, depict graphically the effect of the government running a budget surplus. What happens to the equilibrium price of bonds and the...
6-8 Uruudlit added 5. On your titration curve in 4, clearly label the equivalen buffering is...
 6-8
Uruudlit added 5. On your titration curve in 4, clearly label the equivalen buffering is occurring. Use Option to answer questions 6-8 *. clearly label the equivalence point and any region in which o. Draw the Lewis structure of the acid and mark the acidic hydrogen with an ). acid and mark the acidic hydrogen with an asterisk H- 7. Draw a Lewis structure of the conjugate base of the acid. 8. Suppose the acid is neutralized with a...
6-8
Uruudlit added 5. On your titration curve in 4, clearly label the equivalen buffering is occurring. Use Option to answer questions 6-8 *. clearly label the equivalence point and any region in which o. Draw the Lewis structure of the acid and mark the acidic hydrogen with an ). acid and mark the acidic hydrogen with an asterisk H- 7. Draw a Lewis structure of the conjugate base of the acid. 8. Suppose the acid is neutralized with a...
Draw and label a straight-line demand curve and indicate its elastic and inelastic portions. Clearly indicate...
Draw and label a straight-line demand curve and indicate its elastic and inelastic portions. Clearly indicate the point where the curve is unit elastic. You may need to draw the monopolist's marginal revenue curve.
Answer A-I please (a) Draw a Supply Curve and the Demand Curve for the US Auto market. Label the supply S1 and the demand D1. Label the vertical axis P for Price and label the horizontal axis Q for Qu...
Answer A-I please (a) Draw a Supply Curve and the Demand Curve for the US Auto market. Label the supply S1 and the demand D1. Label the vertical axis P for Price and label the horizontal axis Q for Quantity of Milk. Label on the vertical axis the equilibrium price as P1. Label on the horizontal axis the equilibrium quantity as Q1. Assume now that a tariff of 25% is placed on on all steel and aluminum that is imported...
 < Question 17 of 27 > The graphs show a titration curve for the amino acid histidine. Label the fist curve with the major histidine species at each position. One histidine species will not be used. Label the second curve with the pK, values for the histidine functional groups and the isoelectric point (pl) of histidine. Answer Bank [Hisºj - [His") [ His* 1 - (His 15 20 25 30 IOH equivalents)
 Instructions: In group of 2 or 3 students, discuss the following problems. Graph a D or S curve for each of the situations below and clearly show if there is a movement or shift of the curve. If there is a shift of the curve, write below the graph the factor shifting the curve. Clearly label your graphs and indicate the factor shifting the curves, 13. Suppose the demand and supply for milk are described by the following equations: Q...
 Show the effects of a decrease in nominal income on the interest
rate. Clearly label your graph.
Money Supply MS Money Demand Md Money, AM
Show the effects of a decrease in nominal income on the interest
rate. Clearly label your graph.
Money Supply MS Money Demand Md Money, AM
 Show the effects of a decrease in autonomous spending on output.
Clearly label your graph
Production Slope = 1 Demand Slope = c1 Equilibrium Point: Y=Z Autonomous Spending 5 45° Income, Y
Show the effects of a decrease in autonomous spending on output.
Clearly label your graph
Production Slope = 1 Demand Slope = c1 Equilibrium Point: Y=Z Autonomous Spending 5 45° Income, Y
 6-8
Uruudlit added 5. On your titration curve in 4, clearly label the equivalen buffering is occurring. Use Option to answer questions 6-8 *. clearly label the equivalence point and any region in which o. Draw the Lewis structure of the acid and mark the acidic hydrogen with an ). acid and mark the acidic hydrogen with an asterisk H- 7. Draw a Lewis structure of the conjugate base of the acid. 8. Suppose the acid is neutralized with a...
6-8
Uruudlit added 5. On your titration curve in 4, clearly label the equivalen buffering is occurring. Use Option to answer questions 6-8 *. clearly label the equivalence point and any region in which o. Draw the Lewis structure of the acid and mark the acidic hydrogen with an ). acid and mark the acidic hydrogen with an asterisk H- 7. Draw a Lewis structure of the conjugate base of the acid. 8. Suppose the acid is neutralized with a...
Most questions answered within 3 hours.
-
Where is the error in this code sequence?
String s1 = "Hello";
String s2 = "ello";...
asked 11 months ago -
Financial data for Joel de Paris, Inc., for last year
follow:
Joel de Paris, Inc.
Balance...
asked 11 months ago -
Consider this reaction:
Al2(SO4)3 (aq)+ BaCl3
(aq) Al2Cl6 (aq)- +
3BaSO4(s) . What is the...
asked 11 months ago -
Suppose that Savneet is considering increasing her
recent random sample from 20 car rentals to 40...
asked 11 months ago -
Trucks arrive at an unloading terminal at an average rate of 120
per hour.
Trucks arrive...
asked 11 months ago -
Why are methanol and ethanol completely soluble in water while
octanol is not very little soluble....
asked 11 months ago -
A facilities manager at a university reads in a research report
that the mean amount of...
asked 11 months ago -
When the CuSO4 is rehydrated by adding water to the anhydrous
compound, is this an endothermic...
asked 11 months ago -
A ray of sunlight is passing from diamond into crown glass; the
angle of incidence is...
asked 11 months ago -
A block of mass 0.249 kg is placed on top of a light, vertical
spring of...
asked 11 months ago -
how do the kidneys compensate in the presences of acidosis
a) trigger hyperventilate
b) reserve acid...
asked 11 months ago -
Question 501 pts
The rental rate of capital to the firm increases. Which of the
following...
asked 11 months ago