4. A college counselor claims that there is a negative correlation between the number of days...
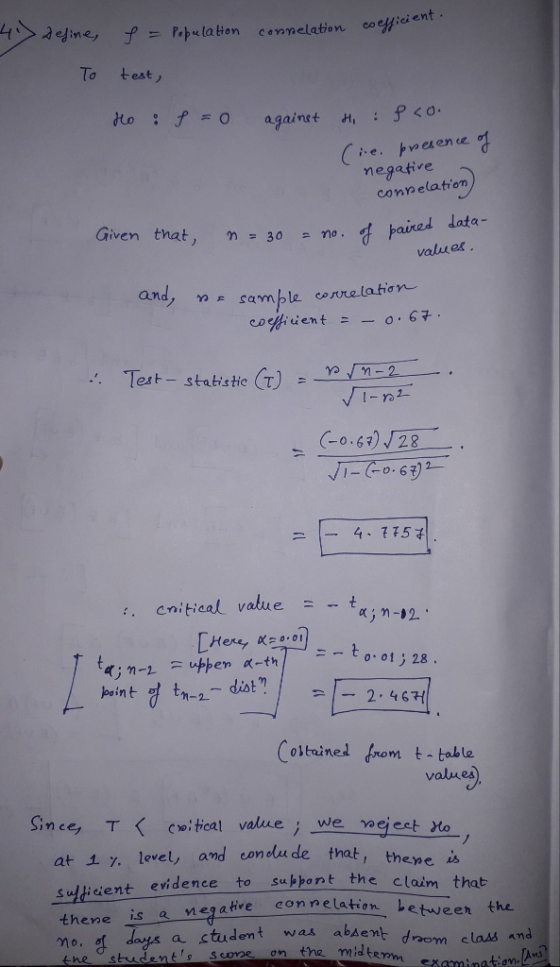
4. A college counselor claims that there is a negative correlation between the number of days a student was absent from class and the student’s score on the midterm examination. A random sample of 30 statistics students was examined. The sample correlation coefficient was computed to be r = -0.67. Assuming that both the attendance and the midterm grades are normally distributed, is the counselor’s claim justified at the 1% level of significance? Explain your answer.
Homework Answers
TOPIC: t-test for the claim regarding the population correlation coefficient.
Add Answer to:
4. A college counselor claims that there is a negative
correlation between the number of days...
A guidance counselor claims that the high school students in a college preparation program have higher...
A guidance counselor claims that the high school students in a college preparation program have higher ACT scores than those in a general program. The sample mean ACT scores for 37 high school students in a college prep program is 22.7 and assume the population standard deviation is 3.5. The sample mean ACT scores for 35 high school students in a general prep program is 21.1. Assume the population standard deviation is 4.9. At = 0.02 , test the...
A publishing company claims that in fall 2019, the average price of college textbooks for a...
A publishing company claims that in fall 2019, the average price of college textbooks for a single semester is $385. Suppose you decide to collect data from a random sample of students to assess whether the publisher's claim is reasonable, and you find that in a random sample of 22 college students, the mean price of textbooks for the fall 2019 semester was $433.50 with a standard deviation of $86.92. At the 0.01 significance level, is there sufficient evidence to...
A college professor claims that the entering class this year appears to be smarter than entering...
 A college professor claims that the entering class this year appears to be smarter than entering classes from previous years. He tests a random sample of 13 of this year's entering students and finds that their mean IQ score is 119, with standard deviation of 11. The college records indicate that the mean IQ score for entering students from previous years is 112. If we assume that the IQ scores of this year's entering class are normally distributed, is there...
A teacher believes that the third homework assignment is a key predictor in how well students...
 A teacher believes that the third homework assignment is a key predictor in how well students will do on the midterm. Let x represent the third homework score and y the midterm exam score. A random sample of last terms students were selected and their grades are shown below. Assume scores are normally distributed. HW3 Midterm 93.672 23.2 11.1 64.856 57.896 87.976 10.1 20.6 10.3 63.488 14.6 70.216 5.5 48.28 11 60.56 23.5 97.56 81.064 15.9 9.9 62.304 5.4 45.984...
A college professor claims that the entering class this year appears to be smarter than entering...
 A college professor claims that the entering class this year appears to be smarter than entering classes from previous years. He tests a random sample of 22 this year's entering students and finds that their mean IQ score is 119, with standard deviation of 15. The college records indicate that the mean IQ score for entering students from previous years is 112. If we assume that the IQ scores of this year's entering class are normally distributed, is there enough...
A college professor claims that the entering class this year appears to be smarter than entering...
 A college professor claims that the entering class this year appears to be smarter than entering classes from previous years. He tests a random sample of 16 of this year's entering students and finds that their mean IQ score is 116, with standard deviation of 10. The college records indicate that the mean IQ score for entering students from previous years is 113. If we assume that the 10 scores of this year's entering dass are normally distributed, is there...
A college professor claims that the entering class this year appears to be smarter than entering classes from previ...
 A college professor claims that the entering class this year appears to be smarter than entering classes from previous years. He tests a random sample of 22 of this year's entering students and finds that their mean 1Q score is 119, with standard deviation of 15. The college records indicate that the mean 1Q score for entering students from previous years is 112. If we assume that the 1Q scores of this year's entering class are normally distributed, is there...
 A college professor claims that the entering class this year appears to be smarter than entering classes from previous years. He tests a random sample of 13 of this year's entering students and finds that their mean IQ score is 119, with standard deviation of 11. The college records indicate that the mean IQ score for entering students from previous years is 112. If we assume that the IQ scores of this year's entering class are normally distributed, is there...
 A teacher believes that the third homework assignment is a key predictor in how well students will do on the midterm. Let x represent the third homework score and y the midterm exam score. A random sample of last terms students were selected and their grades are shown below. Assume scores are normally distributed. HW3 Midterm 93.672 23.2 11.1 64.856 57.896 87.976 10.1 20.6 10.3 63.488 14.6 70.216 5.5 48.28 11 60.56 23.5 97.56 81.064 15.9 9.9 62.304 5.4 45.984...
 A college professor claims that the entering class this year appears to be smarter than entering classes from previous years. He tests a random sample of 22 this year's entering students and finds that their mean IQ score is 119, with standard deviation of 15. The college records indicate that the mean IQ score for entering students from previous years is 112. If we assume that the IQ scores of this year's entering class are normally distributed, is there enough...
 A college professor claims that the entering class this year appears to be smarter than entering classes from previous years. He tests a random sample of 16 of this year's entering students and finds that their mean IQ score is 116, with standard deviation of 10. The college records indicate that the mean IQ score for entering students from previous years is 113. If we assume that the 10 scores of this year's entering dass are normally distributed, is there...
 A college professor claims that the entering class this year appears to be smarter than entering classes from previous years. He tests a random sample of 22 of this year's entering students and finds that their mean 1Q score is 119, with standard deviation of 15. The college records indicate that the mean 1Q score for entering students from previous years is 112. If we assume that the 1Q scores of this year's entering class are normally distributed, is there...
Most questions answered within 3 hours.
-
Where is the error in this code sequence?
String s1 = "Hello";
String s2 = "ello";...
asked 11 months ago -
Financial data for Joel de Paris, Inc., for last year
follow:
Joel de Paris, Inc.
Balance...
asked 11 months ago -
Consider this reaction:
Al2(SO4)3 (aq)+ BaCl3
(aq) Al2Cl6 (aq)- +
3BaSO4(s) . What is the...
asked 11 months ago -
Suppose that Savneet is considering increasing her
recent random sample from 20 car rentals to 40...
asked 11 months ago -
Trucks arrive at an unloading terminal at an average rate of 120
per hour.
Trucks arrive...
asked 11 months ago -
Why are methanol and ethanol completely soluble in water while
octanol is not very little soluble....
asked 11 months ago -
A facilities manager at a university reads in a research report
that the mean amount of...
asked 11 months ago -
When the CuSO4 is rehydrated by adding water to the anhydrous
compound, is this an endothermic...
asked 11 months ago -
A ray of sunlight is passing from diamond into crown glass; the
angle of incidence is...
asked 11 months ago -
A block of mass 0.249 kg is placed on top of a light, vertical
spring of...
asked 11 months ago -
how do the kidneys compensate in the presences of acidosis
a) trigger hyperventilate
b) reserve acid...
asked 11 months ago -
Question 501 pts
The rental rate of capital to the firm increases. Which of the
following...
asked 11 months ago