 How would I do this on a
Ti-84CE Calculator?
How would I do this on a
Ti-84CE Calculator?
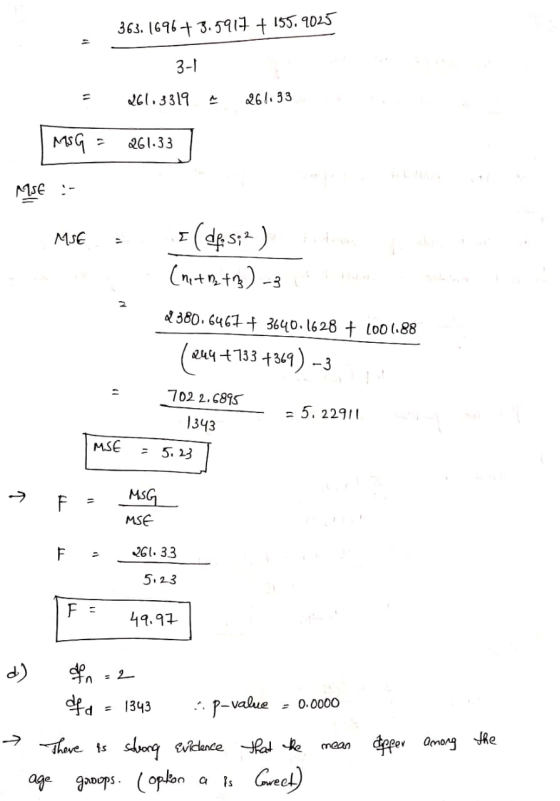
"The phenomenon of road rage has been frequently discussed but infrequently examined." So begins a report based on interviews with 1346 randomly selected drivers. The respondents' answers to interview questions produced scores on an 'angry/threatening driving scale with values between 0 and 19, larger values indicating more angry/threatening behaviors. What driver characteristics go with road rage? There were no significant differences among races or levels of education. What about the effect of the driver's age? Here are the means and standard deviations for a measure of "angry/threatening driving" for random samples of drivers in three age groups:
Age group Less than 30 years 244 2.46 3.13 30 to 55 years 733 1.17 2.23 Over 55 years 3 69 0.59 1.65
(a) The distributions of responses are somewhat right-skewed. ANOVA is nonetheless safe for these data. Why? The samples are random. The standard deviations are similar. The sample sizes are large.
(b) Do the standard deviations satisfy the guideline for ANOVA inference? (Round your answer to two decimal places.) Yes , the ratio is
(c) Calculate the overall mean response, the mean squares MSG and MSE, and the ANOVA F statistic. (Round your answers to two decimal places.)
(d) Which F distribution would you use to find the p-value of the ANOVA F test? (Enter your answers as a comma-separated list.) Software gives P < 0.001. Write a brief conclusion based on the sample means and the ANOVA F test. There is strong evidence that the means differ among the age groups. There is not enough evidence to conclude that the means differ among the age groups.
Homework Answers

"The phenomenon of road rage has been frequently discussed but infrequently examined." So begins a report...
 "The phenomenon of road rage has been frequently discussed but infrequently examined." So begins a report based on interviews with 1382 randomly selected drivers. The respondents' answers to interview questions produced scores on an "angry/threatening driving scale" with values between 0 and 19. Does the driver's age affect road rage? Here are the mean responses for three age-groups. The report says that F = 34.96 with p-value < 0.01. What is the null hypothesis for the ANOVA F test? All...
Do SAT scores for high school students differ depending on the students' intended field of study?...
 Do SAT scores for high school students differ depending on the students' intended field of study? A study compared 15 students who intended to major in engineering with 15 students who intended to major in language and literature. Given in the accompanying table are the means and standard deviations of the scores on the verbal and mathematics portion of the SAT for the two groups of students: Engineering Language/literature Verbal у-446, 8-42 Math У-548, s-57 У-517, s:: 52 у-: 534,8...
Suppose that you theorize that the average ages of White Oaks, Quercus alba
 Suppose that you theorize that the average ages of White Oaks, Quercus alba, in the following three locations. Site 1 Lower peninsula, Ml, ear Lake Michigan Site 2 Upper peninsula, MI, near Lake Superior and Site 3 Lower peninsula, Ml, near Saginaw Bay (are not all the same). To test this theory, you take 3 simple random samples of 35 trees from each site, and record the ages of each White Oak in each sample. (a) What are the hypotheses? \(\mathrm{H}_{0}:...
I. A researcher is interested in the impact of mace ethnicity on attitudes towards the death...
 I. A researcher is interested in the impact of mace ethnicity on attitudes towards the death penalty, Conduct a chi-square best to examine whether t estoward the death penalty vary across race. Black White Hispanic Total A State the mall and research hypotheses ning ene 25 B Conduct the chi e st Calculate the expected frequencies and the chi Decherche d your des offre ada 1skola fase M a dec i ne To credit for this to you all Expected...
Researchers wanted to determine if the psychological profile of healthy children was different than for children...
Researchers wanted to determine if the psychological profile of healthy children was different than for children suffering from recurrent abdominal pain? (RAP) or recurring headaches. A total of 210 children and adolescents were studied and their psychological profiles were graded according to a child behavior checklist. Children were stratified in two age? groups: 4 to 11 years and 12 to 18 years. The results of the study are summarized in the accompanying table. Complete parts ?(a) through? (f) below. n...
Reserve Problems Chapter 13 Section 2 Problem 2 An article in the American Journal of Emergency...
 Reserve Problems Chapter 13 Section 2 Problem 2 An article in the American Journal of Emergency Medicine compared the ability to detect acute traumatic aortic injury (ATAI) on cervical x-ray images. The data consisted of 13 cases of ATAI, 19 cases with negative aortography (NAO) and 18 cases with multiple trauma (MT) without aortography. Measurements of the cervical soft-tissue width at the third cervical vertebrae generated the following results. Averages were 9.9, 9.2 and 7.4 mm and standard deviations were...
the questions for the table for number 14 was added For questions 13-16: Light exposure in...
 the questions for the table for number 14 was added
For questions 13-16: Light exposure in mice Studies show that night-time light exposure is hamful to human health. A recent 6-week study randomly assigned lab mice to one of three conditions: LD (Group 1) had a standard light/dark cycle cach 24-hour period; (Group 2) LL had bright light all the time, and (Group 3) DM had dim light when there nomally would have been darkness. The rescarchers hoped to investigate...
the questions for the table for number 14 was added
For questions 13-16: Light exposure in mice Studies show that night-time light exposure is hamful to human health. A recent 6-week study randomly assigned lab mice to one of three conditions: LD (Group 1) had a standard light/dark cycle cach 24-hour period; (Group 2) LL had bright light all the time, and (Group 3) DM had dim light when there nomally would have been darkness. The rescarchers hoped to investigate...
Comparing two means: When drink drove a student to statistics (Rubric included) Instructions For this assignment,...
Comparing two means: When drink drove a student to statistics (Rubric included) Instructions For this assignment, you review this week’s Learning Resources and then perform a two-sample independent t test and an ANOVA related to the dataset that was utilized in the week 2 SPSS application assignment. Import the data into SPSS; or, if you correctly saved the data file in Week 2, you may open and use that saved file to complete this assignment. Type your answers to all...
hello, I just need help on the process of getting question 8 thanks Use the information...
 hello,
I just need help on the process of getting question
8
thanks
Use the information given below to answer the next three questions. February 14, 2006, marked the 60th anniversary of ENIAC, the first computer in the world. In a Computerworld magazine interview, ENIAC's inventor Pres Eckert explains how they chose the right type of wires back in 1946: "We only used wire that passed the mouse test". They threw a number of wire samples in a cage full...
hello,
I just need help on the process of getting question
8
thanks
Use the information given below to answer the next three questions. February 14, 2006, marked the 60th anniversary of ENIAC, the first computer in the world. In a Computerworld magazine interview, ENIAC's inventor Pres Eckert explains how they chose the right type of wires back in 1946: "We only used wire that passed the mouse test". They threw a number of wire samples in a cage full...
The first two questions refer to the following information: Researchers developed an online tool to help...
The first two questions refer to the following information: Researchers developed an online tool to help ESL students learn prepositions and metaphors. A study measuring academic success in ESL students randomly sampled 100 Spanish speaking ESL students using traditional ESL classes and the new language tool and 81 Portuguese speaking ESL students using traditional ESL classes and the new language tool, and scored them on a common English fluency scale (higher score representing greater degree of fluency). The researchers suspected...
 "The phenomenon of road rage has been frequently discussed but infrequently examined." So begins a report based on interviews with 1382 randomly selected drivers. The respondents' answers to interview questions produced scores on an "angry/threatening driving scale" with values between 0 and 19. Does the driver's age affect road rage? Here are the mean responses for three age-groups. The report says that F = 34.96 with p-value < 0.01. What is the null hypothesis for the ANOVA F test? All...
 Do SAT scores for high school students differ depending on the students' intended field of study? A study compared 15 students who intended to major in engineering with 15 students who intended to major in language and literature. Given in the accompanying table are the means and standard deviations of the scores on the verbal and mathematics portion of the SAT for the two groups of students: Engineering Language/literature Verbal у-446, 8-42 Math У-548, s-57 У-517, s:: 52 у-: 534,8...
 Suppose that you theorize that the average ages of White Oaks, Quercus alba, in the following three locations. Site 1 Lower peninsula, Ml, ear Lake Michigan Site 2 Upper peninsula, MI, near Lake Superior and Site 3 Lower peninsula, Ml, near Saginaw Bay (are not all the same). To test this theory, you take 3 simple random samples of 35 trees from each site, and record the ages of each White Oak in each sample. (a) What are the hypotheses? \(\mathrm{H}_{0}:...
 I. A researcher is interested in the impact of mace ethnicity on attitudes towards the death penalty, Conduct a chi-square best to examine whether t estoward the death penalty vary across race. Black White Hispanic Total A State the mall and research hypotheses ning ene 25 B Conduct the chi e st Calculate the expected frequencies and the chi Decherche d your des offre ada 1skola fase M a dec i ne To credit for this to you all Expected...
 Reserve Problems Chapter 13 Section 2 Problem 2 An article in the American Journal of Emergency Medicine compared the ability to detect acute traumatic aortic injury (ATAI) on cervical x-ray images. The data consisted of 13 cases of ATAI, 19 cases with negative aortography (NAO) and 18 cases with multiple trauma (MT) without aortography. Measurements of the cervical soft-tissue width at the third cervical vertebrae generated the following results. Averages were 9.9, 9.2 and 7.4 mm and standard deviations were...
 the questions for the table for number 14 was added
For questions 13-16: Light exposure in mice Studies show that night-time light exposure is hamful to human health. A recent 6-week study randomly assigned lab mice to one of three conditions: LD (Group 1) had a standard light/dark cycle cach 24-hour period; (Group 2) LL had bright light all the time, and (Group 3) DM had dim light when there nomally would have been darkness. The rescarchers hoped to investigate...
the questions for the table for number 14 was added
For questions 13-16: Light exposure in mice Studies show that night-time light exposure is hamful to human health. A recent 6-week study randomly assigned lab mice to one of three conditions: LD (Group 1) had a standard light/dark cycle cach 24-hour period; (Group 2) LL had bright light all the time, and (Group 3) DM had dim light when there nomally would have been darkness. The rescarchers hoped to investigate...
 hello,
I just need help on the process of getting question
8
thanks
Use the information given below to answer the next three questions. February 14, 2006, marked the 60th anniversary of ENIAC, the first computer in the world. In a Computerworld magazine interview, ENIAC's inventor Pres Eckert explains how they chose the right type of wires back in 1946: "We only used wire that passed the mouse test". They threw a number of wire samples in a cage full...
hello,
I just need help on the process of getting question
8
thanks
Use the information given below to answer the next three questions. February 14, 2006, marked the 60th anniversary of ENIAC, the first computer in the world. In a Computerworld magazine interview, ENIAC's inventor Pres Eckert explains how they chose the right type of wires back in 1946: "We only used wire that passed the mouse test". They threw a number of wire samples in a cage full...
Most questions answered within 3 hours.
-
Where is the error in this code sequence?
String s1 = "Hello";
String s2 = "ello";...
asked 10 months ago -
Financial data for Joel de Paris, Inc., for last year
follow:
Joel de Paris, Inc.
Balance...
asked 10 months ago -
Consider this reaction:
Al2(SO4)3 (aq)+ BaCl3
(aq) Al2Cl6 (aq)- +
3BaSO4(s) . What is the...
asked 10 months ago -
Suppose that Savneet is considering increasing her
recent random sample from 20 car rentals to 40...
asked 10 months ago -
Trucks arrive at an unloading terminal at an average rate of 120
per hour.
Trucks arrive...
asked 10 months ago -
Why are methanol and ethanol completely soluble in water while
octanol is not very little soluble....
asked 10 months ago -
A facilities manager at a university reads in a research report
that the mean amount of...
asked 10 months ago -
When the CuSO4 is rehydrated by adding water to the anhydrous
compound, is this an endothermic...
asked 10 months ago -
A ray of sunlight is passing from diamond into crown glass; the
angle of incidence is...
asked 10 months ago -
A block of mass 0.249 kg is placed on top of a light, vertical
spring of...
asked 10 months ago -
how do the kidneys compensate in the presences of acidosis
a) trigger hyperventilate
b) reserve acid...
asked 10 months ago -
Question 501 pts
The rental rate of capital to the firm increases. Which of the
following...
asked 10 months ago