![Listed below are the heights from a sample of male students (in inches 72 70 69 75 69 71 75 72 74 73 70 75 74 71 78 65 75 70 a. [3 pts] Create an ordered stem and leaf display for these data. b. [1 pt] How many students are measured? c. [1 pt] What percentage of students are at least 70? (Round to 1 decimal place.)](http://img.homeworklib.com/questions/034d3150-7429-11ea-ab66-c17d76dd8c4b.png?x-oss-process=image/resize,w_560)
Homework Answers


Interpretation:
The stem-and-leaf display enables that the distribution is approximately right skewed distribution of the sample of heights of the students (X). Since, the mean is greater than the median. The curve looks like an approximate symmetric curve.
---------------------------------------------------------------------------------------------------------------------------------------------------------
Add Answer to:
Thank you!
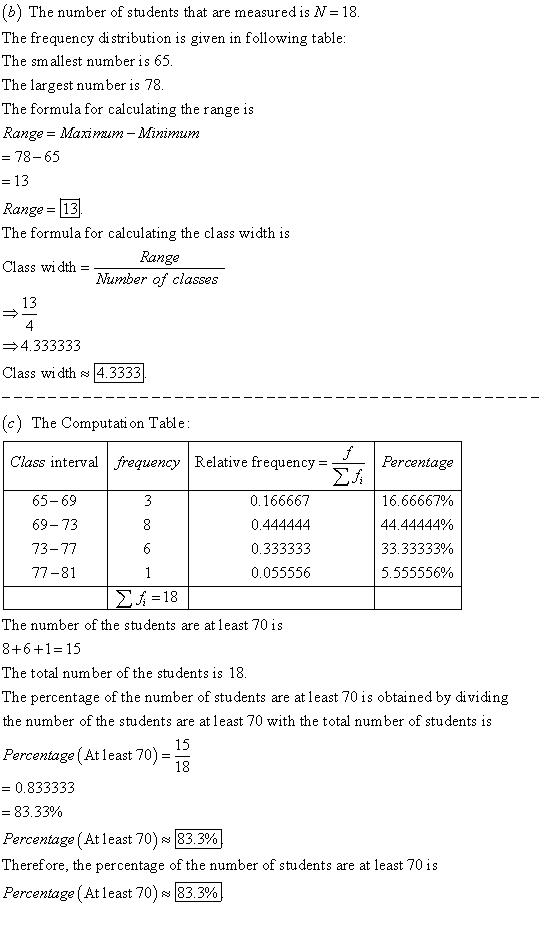
Listed below are the heights from a sample of male students (in inches 72...
Listed below are the heights from a sample of male students (in inches). 75 72 72...
Listed below are the heights from a sample of male students (in inches). 75 72 72 73 74 65 69 74 70 70 71 75 71 75 69 75 78 70 [3 pts]Create an ordered stem and leaf display for these data. [1 pt] How many students are measured? [1 pt] What percentage of students are at least 70”? (Round to 1 decimal place.) 2. As of 2017, the following are the ages, in chronological order, at which the last...
Show your work AND explain your reasoning using complete English sentences. Explanations must directly follow the...
Show your work AND explain your reasoning using complete English sentences. Explanations must directly follow the solution for each part of the problem. Listed below are the heights from a sample of male students (in inches). 75 72 72 73 74 65 69 74 70 70 71 75 71 75 69 75 78 70 a. Create an ordered stem and leaf display for these data. b. How many students are measured? c. What percentage of students are at least 70”?...
The heights (in inches) of 30 adult males are listed below 70 72 71 70 69...
The heights (in inches) of 30 adult males are listed below 70 72 71 70 69 73 69 68 70 71 67 71 70 74 69 68 71 71 71 72 69 71 68 67 73 74 70 71 69 68 Create a frequency distribution using for classes and answer the following: a) Find the midpoint of each class, and calculate the mean of frequency distribution b) Find the standard deviation of the frequency distribution c) Create a box and...
A random sample of 30 male college students was selected, and their heights were measured. The...
A random sample of 30 male college students was selected, and their heights were measured. The heights (in inches) are given below. 67 69 70 69 67 66 73 69 70 67 73 69 68 68 69 73 72 67 68 71 73 71 71 72 70 67 66 74 68 72 (a) Complete the frequency distribution for the data. Make sure to enter your answers for the relative frequency as decimals, rounded to the nearest tenth. Height Frequency Relative...
400. The following random sample of 28 female basketball player heights, in inches, is: 63 71...
400. The following random sample of 28 female basketball player heights, in inches, is: 63 71 69 65 73 84 70 69 67 74 75 68 65 63 67 69 68 72 73 75 72 75 73 68 69 74 65 65 (Σx = 1961 Σx2 = 137,911) Using the box plot, the middle 50% of the heights fall between the heights:
44The following random sample of 28 female basketball player heights, in inches, is: 63 71 69...
44The following random sample of 28 female basketball player heights, in inches, is: 63 71 69 65 73 84 70 69 67 74 75 68 65 63 67 69 68 72 73 75 72 75 73 68 69 74 65 65 (Σx = 1961 Σx2 = 137,911) The shape of the box plot representing this distribution of female basketball player heights is:
uren OHM Due in 18 minutes. Due Sun 0 A random sample of 30 male college...
 uren OHM Due in 18 minutes. Due Sun 0 A random sample of 30 male college students was selected, and their heights were measured. The heights (in inches) are given below. Sho 72 69 73 69 66 67 67 7171 74 72 68 66 71 69 67 66 74 71 73 68 68 71 72 69 74 66 70 73 69 (a) Complete the frequency distribution for t he data. Make sure to enter your answers for the relative frequency...
use the numbers on excel 6.2.13 In Exercise 6.2.8, we presented height data that were self-reported...
 use the numbers on excel
6.2.13 In Exercise 6.2.8, we presented height data that were self-reported by female undergraduate engineering students in a core course at ASU. In the same class, the male students self-reported their heights as follows. Construct a comparative stem-and-leaf diagram by listing the stems in the center of the display and then placing the female leaves on the left and the male leaves on the right. Comment on any important features that you notice in this...
use the numbers on excel
6.2.13 In Exercise 6.2.8, we presented height data that were self-reported by female undergraduate engineering students in a core course at ASU. In the same class, the male students self-reported their heights as follows. Construct a comparative stem-and-leaf diagram by listing the stems in the center of the display and then placing the female leaves on the left and the male leaves on the right. Comment on any important features that you notice in this...
Are there outliers? If so what are they? The following random sample of 28 female basketball...
 Are there outliers? If so what are they?
The following random sample of 28 female basketball player heights, in inches, is: 63 71 69 65 73 84 70 69 67 74 75 68 65 63 67 69 68 72 73 75 72 75 73 68 69 74 65 65 (Ex= 1961 Ex2 = 137,911)
Are there outliers? If so what are they?
The following random sample of 28 female basketball player heights, in inches, is: 63 71 69 65 73 84 70 69 67 74 75 68 65 63 67 69 68 72 73 75 72 75 73 68 69 74 65 65 (Ex= 1961 Ex2 = 137,911)
For the following data "Class Data: Heights by gender" Male: 69 72.5 71 70 69 66...
For the following data "Class Data: Heights by gender" Male: 69 72.5 71 70 69 66 65 72 73 67 71 69 68 Female: 65 63 62 63.5 68 65 64 64 62.75 68 Make back to back stem plots of heights. Compare the distributions with respect to height, with reference to center, spread and shape of the distribution.
 uren OHM Due in 18 minutes. Due Sun 0 A random sample of 30 male college students was selected, and their heights were measured. The heights (in inches) are given below. Sho 72 69 73 69 66 67 67 7171 74 72 68 66 71 69 67 66 74 71 73 68 68 71 72 69 74 66 70 73 69 (a) Complete the frequency distribution for t he data. Make sure to enter your answers for the relative frequency...
 use the numbers on excel
6.2.13 In Exercise 6.2.8, we presented height data that were self-reported by female undergraduate engineering students in a core course at ASU. In the same class, the male students self-reported their heights as follows. Construct a comparative stem-and-leaf diagram by listing the stems in the center of the display and then placing the female leaves on the left and the male leaves on the right. Comment on any important features that you notice in this...
use the numbers on excel
6.2.13 In Exercise 6.2.8, we presented height data that were self-reported by female undergraduate engineering students in a core course at ASU. In the same class, the male students self-reported their heights as follows. Construct a comparative stem-and-leaf diagram by listing the stems in the center of the display and then placing the female leaves on the left and the male leaves on the right. Comment on any important features that you notice in this...
 Are there outliers? If so what are they?
The following random sample of 28 female basketball player heights, in inches, is: 63 71 69 65 73 84 70 69 67 74 75 68 65 63 67 69 68 72 73 75 72 75 73 68 69 74 65 65 (Ex= 1961 Ex2 = 137,911)
Are there outliers? If so what are they?
The following random sample of 28 female basketball player heights, in inches, is: 63 71 69 65 73 84 70 69 67 74 75 68 65 63 67 69 68 72 73 75 72 75 73 68 69 74 65 65 (Ex= 1961 Ex2 = 137,911)
Most questions answered within 3 hours.
-
Where is the error in this code sequence?
String s1 = "Hello";
String s2 = "ello";...
asked 10 months ago -
Financial data for Joel de Paris, Inc., for last year
follow:
Joel de Paris, Inc.
Balance...
asked 10 months ago -
Consider this reaction:
Al2(SO4)3 (aq)+ BaCl3
(aq) Al2Cl6 (aq)- +
3BaSO4(s) . What is the...
asked 10 months ago -
Suppose that Savneet is considering increasing her
recent random sample from 20 car rentals to 40...
asked 10 months ago -
Trucks arrive at an unloading terminal at an average rate of 120
per hour.
Trucks arrive...
asked 10 months ago -
Why are methanol and ethanol completely soluble in water while
octanol is not very little soluble....
asked 10 months ago -
A facilities manager at a university reads in a research report
that the mean amount of...
asked 10 months ago -
When the CuSO4 is rehydrated by adding water to the anhydrous
compound, is this an endothermic...
asked 10 months ago -
A ray of sunlight is passing from diamond into crown glass; the
angle of incidence is...
asked 10 months ago -
A block of mass 0.249 kg is placed on top of a light, vertical
spring of...
asked 10 months ago -
how do the kidneys compensate in the presences of acidosis
a) trigger hyperventilate
b) reserve acid...
asked 10 months ago -
Question 501 pts
The rental rate of capital to the firm increases. Which of the
following...
asked 10 months ago