
Homework Answers


Add Answer to:
Portray an initial equilibrium denoted by the subscript 0, in the savings and Investment space, Money...
Portray an initial equilibrium denoted by the subscript 0, in the savings and Investment space, Money Market, the IS-LM...
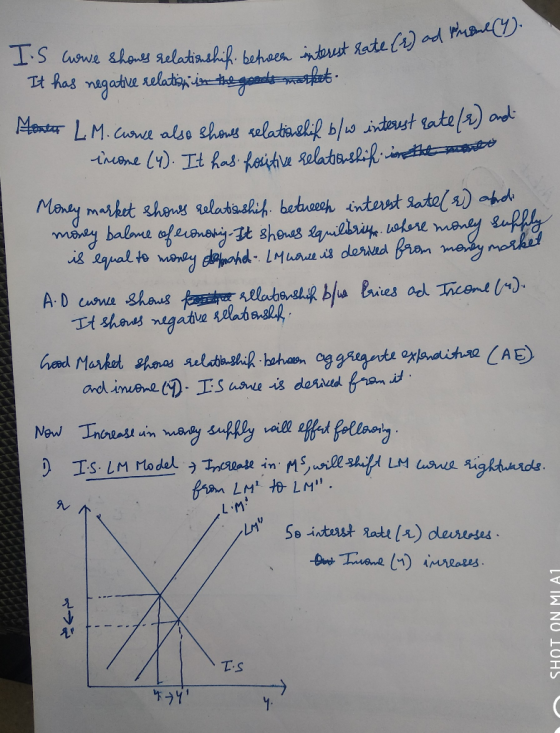
 Portray an initial equilibrium denoted by the subscript 0, in
the savings and Investment space, Money Market, the IS-LM space,
and the AD space, and show how an increase in the money supply
would affect these. Be sure to label all shift variables and list
causal/ explained variables. Assume MPS < MPI.
Goods or Savings-Investment Market IS-LM IS Money Market AD -A
Portray an initial equilibrium denoted by the subscript 0, in
the savings and Investment space, Money Market, the IS-LM space,
and the AD space, and show how an increase in the money supply
would affect these. Be sure to label all shift variables and list
causal/ explained variables. Assume MPS < MPI.
Goods or Savings-Investment Market IS-LM IS Money Market AD -A
9-10) Portray an initial equilibrium denoted by the subscript 0, in the savings and Investment space,...
 9-10) Portray an initial equilibrium denoted by the subscript 0, in the savings and Investment space, the Money Market, the IS-LM space, and the AD space, and show how an increase in the price level which increases real output would affect these. Be sure to label all shift variables. Assume MPS - MPI. IS-LM Goods or Savings-Investment Market r Money Market AD
Recall the IS-LM model. In particular, the goods-market equilibrium condition was Y = C (Y −...
Recall the IS-LM model. In particular, the goods-market equilibrium condition was Y = C (Y − T ) + I (r) + G, and the money-market equilibrium condition was m = L (r, Y ). Here, the exogenous variables are G (government spending), T (taxes), and m (real money supply). The endogenous variables are Y (output, or income) and r (real interest rate). C (·) is the consumption function, which is increasing in disposable income Y − T , but...
Consider the following short-run model of equilibrium in the foreign exchange market, money market, and goods...
Consider the following short-run model of equilibrium in the foreign exchange market, money market, and goods market: (1) R=R∗+Ee−EE, (2) MsP=L(R,Y), (3) Y=C(Y−T)+I+G+CA(q,Y−T). All variables have the interpretation given in class (in particular, q=EP∗P is the country's real exchange rate). Suppose that the government increases temporarily its spending by ΔG. a) Explain how the endogenous variables of this model adjust to the new short-run equilibrium. b) Suppose now that the government combines the temporary increase in government spending with a...
OY 10. By referring to Figure 7-1, an increase in the money stock a shifts the...
 OY 10. By referring to Figure 7-1, an increase in the money stock a shifts the LM schedule to the right from LMoto LM b shifts the LM schedule to the left from LMo to LM e leaves the LM curve unchanged at LM. d. shifts neither the IS nor the LM schedule. 11. Changes in all of the following shift the LM curve except a. the price level. b. income. c. the money supply. d. money demand. e. all...
Compute the new equilibrium values of * * Y i ' and ' .
 Compute the new equilibrium values of * * Y i ' and ' .
Consider the following IS-LM model of a closed macroeconomy The Goods Market (1)Components of planned aggregate expenditure (2) Consumption function (3) (4) Government expenditure (5) Disposable income (6)Tax function (7) Goods market equilibrium 1=bo +by-b21 G=G Y,Y-T Planned investment The Money Market し=do +d,Y-d,i (8) (9) (10) Money demand Money supply Money market equilibrium MIP-MIP All of the variables here are as listed in the notes,...
Compute the new equilibrium values of * * Y i ' and ' .
Consider the following IS-LM model of a closed macroeconomy The Goods Market (1)Components of planned aggregate expenditure (2) Consumption function (3) (4) Government expenditure (5) Disposable income (6)Tax function (7) Goods market equilibrium 1=bo +by-b21 G=G Y,Y-T Planned investment The Money Market し=do +d,Y-d,i (8) (9) (10) Money demand Money supply Money market equilibrium MIP-MIP All of the variables here are as listed in the notes,...
Consider the IS-LM and aggregate demand/aggregate supply model of Chapters 11 and 12. Consider a reduction...
Consider the IS-LM and aggregate demand/aggregate supply model of Chapters 11 and 12. Consider a reduction in the level of taxes, starting from an initial situation in which output is equal to its natural level. a) Depict the short-run effects of the reduction in T using 3 graphs: one for the market for goods and services, one for the IS-LM curves, and one for the Aggregate Demand and Supply curves. How do the new short-run equilibrium values of r, Y...
solve using attached graphs if neccesary (2) 140 points Use the standard short-run AD-AS model to...
 solve using attached graphs if neccesary
(2) 140 points Use the standard short-run AD-AS model to answer this question. (Assume that all the taxes in this model are income taxes.) Economists do not agree on the cause of the 1991-92 recession in the U.S. The two most promising explanations are: (A) the "oil price shock" explanation, and (B) the "credit crunch" explanation. The oil price shock explanation says that when Iraq invaded Kuwait in the summer of 1990, this created...
solve using attached graphs if neccesary
(2) 140 points Use the standard short-run AD-AS model to answer this question. (Assume that all the taxes in this model are income taxes.) Economists do not agree on the cause of the 1991-92 recession in the U.S. The two most promising explanations are: (A) the "oil price shock" explanation, and (B) the "credit crunch" explanation. The oil price shock explanation says that when Iraq invaded Kuwait in the summer of 1990, this created...
Savings/Investment in Class GDP = 10 Consumption = 7 Government Spending = 2 Private Savings = 1 Transfer Payments...
 Savings/Investment in Class GDP = 10 Consumption = 7 Government Spending = 2 Private Savings = 1 Transfer Payments = 1 A) Calculate Taxes, Investment, Public Savings and National Savings B) Draw the graph of the market for loanable funds, assuming the equilibrium interest rate i* = 3% Make sure to label the axis and equilibrium points C) If G increases so that now G = 2.5, recalculate Public Savings, National Savings and Investment. (assume that any other variables stay...
Question 2: Money market Suppose that the money demand function is (M/P) = 0.75 Y -...
 Question 2: Money market Suppose that the money demand function is (M/P) = 0.75 Y - 200r The money supply M is 6000 and the price level is 2. a. Graph the supply for real money balances on a new graph (label it "figure 3"), and label the supply of real money balances (M/P). g. Suppose that the income is 6000. Complete Table 1 and draw the demand for real money balances curve ((M/P'] in figure 3. Find the value...
 Portray an initial equilibrium denoted by the subscript 0, in
the savings and Investment space, Money Market, the IS-LM space,
and the AD space, and show how an increase in the money supply
would affect these. Be sure to label all shift variables and list
causal/ explained variables. Assume MPS < MPI.
Goods or Savings-Investment Market IS-LM IS Money Market AD -A
Portray an initial equilibrium denoted by the subscript 0, in
the savings and Investment space, Money Market, the IS-LM space,
and the AD space, and show how an increase in the money supply
would affect these. Be sure to label all shift variables and list
causal/ explained variables. Assume MPS < MPI.
Goods or Savings-Investment Market IS-LM IS Money Market AD -A
 9-10) Portray an initial equilibrium denoted by the subscript 0, in the savings and Investment space, the Money Market, the IS-LM space, and the AD space, and show how an increase in the price level which increases real output would affect these. Be sure to label all shift variables. Assume MPS - MPI. IS-LM Goods or Savings-Investment Market r Money Market AD
 OY 10. By referring to Figure 7-1, an increase in the money stock a shifts the LM schedule to the right from LMoto LM b shifts the LM schedule to the left from LMo to LM e leaves the LM curve unchanged at LM. d. shifts neither the IS nor the LM schedule. 11. Changes in all of the following shift the LM curve except a. the price level. b. income. c. the money supply. d. money demand. e. all...
 Compute the new equilibrium values of * * Y i ' and ' .
Consider the following IS-LM model of a closed macroeconomy The Goods Market (1)Components of planned aggregate expenditure (2) Consumption function (3) (4) Government expenditure (5) Disposable income (6)Tax function (7) Goods market equilibrium 1=bo +by-b21 G=G Y,Y-T Planned investment The Money Market し=do +d,Y-d,i (8) (9) (10) Money demand Money supply Money market equilibrium MIP-MIP All of the variables here are as listed in the notes,...
Compute the new equilibrium values of * * Y i ' and ' .
Consider the following IS-LM model of a closed macroeconomy The Goods Market (1)Components of planned aggregate expenditure (2) Consumption function (3) (4) Government expenditure (5) Disposable income (6)Tax function (7) Goods market equilibrium 1=bo +by-b21 G=G Y,Y-T Planned investment The Money Market し=do +d,Y-d,i (8) (9) (10) Money demand Money supply Money market equilibrium MIP-MIP All of the variables here are as listed in the notes,...
 solve using attached graphs if neccesary
(2) 140 points Use the standard short-run AD-AS model to answer this question. (Assume that all the taxes in this model are income taxes.) Economists do not agree on the cause of the 1991-92 recession in the U.S. The two most promising explanations are: (A) the "oil price shock" explanation, and (B) the "credit crunch" explanation. The oil price shock explanation says that when Iraq invaded Kuwait in the summer of 1990, this created...
solve using attached graphs if neccesary
(2) 140 points Use the standard short-run AD-AS model to answer this question. (Assume that all the taxes in this model are income taxes.) Economists do not agree on the cause of the 1991-92 recession in the U.S. The two most promising explanations are: (A) the "oil price shock" explanation, and (B) the "credit crunch" explanation. The oil price shock explanation says that when Iraq invaded Kuwait in the summer of 1990, this created...
 Savings/Investment in Class GDP = 10 Consumption = 7 Government Spending = 2 Private Savings = 1 Transfer Payments = 1 A) Calculate Taxes, Investment, Public Savings and National Savings B) Draw the graph of the market for loanable funds, assuming the equilibrium interest rate i* = 3% Make sure to label the axis and equilibrium points C) If G increases so that now G = 2.5, recalculate Public Savings, National Savings and Investment. (assume that any other variables stay...
 Question 2: Money market Suppose that the money demand function is (M/P) = 0.75 Y - 200r The money supply M is 6000 and the price level is 2. a. Graph the supply for real money balances on a new graph (label it "figure 3"), and label the supply of real money balances (M/P). g. Suppose that the income is 6000. Complete Table 1 and draw the demand for real money balances curve ((M/P'] in figure 3. Find the value...
Most questions answered within 3 hours.
-
Where is the error in this code sequence?
String s1 = "Hello";
String s2 = "ello";...
asked 10 months ago -
Financial data for Joel de Paris, Inc., for last year
follow:
Joel de Paris, Inc.
Balance...
asked 10 months ago -
Consider this reaction:
Al2(SO4)3 (aq)+ BaCl3
(aq) Al2Cl6 (aq)- +
3BaSO4(s) . What is the...
asked 10 months ago -
Suppose that Savneet is considering increasing her
recent random sample from 20 car rentals to 40...
asked 10 months ago -
Trucks arrive at an unloading terminal at an average rate of 120
per hour.
Trucks arrive...
asked 10 months ago -
Why are methanol and ethanol completely soluble in water while
octanol is not very little soluble....
asked 10 months ago -
A facilities manager at a university reads in a research report
that the mean amount of...
asked 10 months ago -
When the CuSO4 is rehydrated by adding water to the anhydrous
compound, is this an endothermic...
asked 10 months ago -
A ray of sunlight is passing from diamond into crown glass; the
angle of incidence is...
asked 10 months ago -
A block of mass 0.249 kg is placed on top of a light, vertical
spring of...
asked 10 months ago -
how do the kidneys compensate in the presences of acidosis
a) trigger hyperventilate
b) reserve acid...
asked 10 months ago -
Question 501 pts
The rental rate of capital to the firm increases. Which of the
following...
asked 10 months ago