Current Ratio
Quick Ratio
Times Interest Earned
Debt to Equity
Fixed Asset Turnover
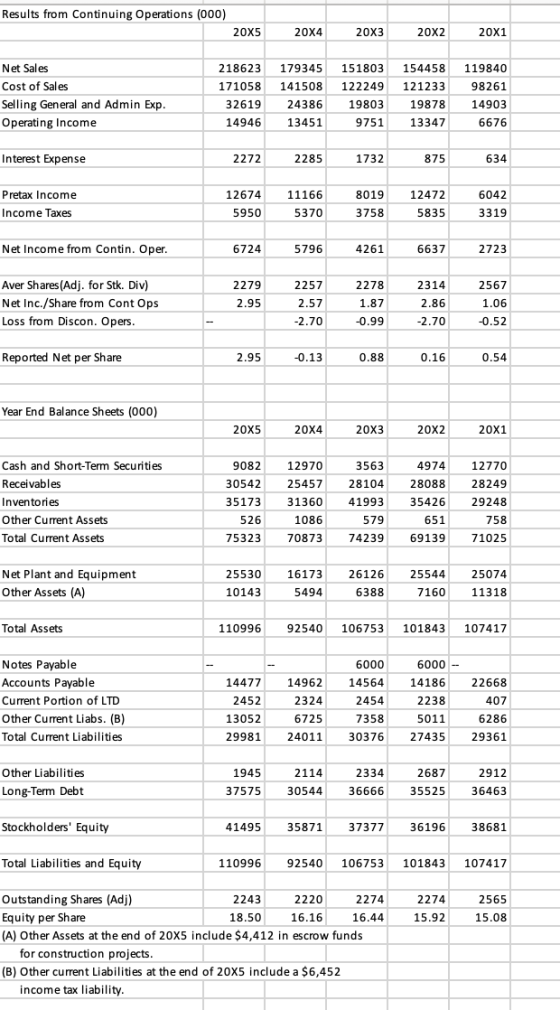
- Compute these ratios for all five years of data and present a table of these ratios.
Homework Answers
| Ratios | 2015 | 2014 | 2013 | 2012 | 2011 | |
| 1 |
Current Ratio = Total Current Assets / Total Current Liabilities |
75323
/ 29981 = 2.512 |
70873
/ 24011 = 2.951 |
74239
/ 30376 = 2.444 |
69139 /
27435 = 2.52 |
71025
/ 29361 = 2.419 |
| 2 | Quick
Ratio = (Total Current Assets - Inventories) / Total Current Liabilities |
40150 /
29981 = 1.339 |
39513 /
24011 = 1.645 |
32246 /
30376 = 1.061 |
33713 /
27435 = 1.229 |
41777 /
29361 = 1.423 |
| 3 | Times
Interest Earned = Operation Income / Interest Expense |
14946 /
2272 = 6.578 |
13451 /
2285 = 5.887 |
9751 /
1732 = 5.630 |
13347 /
875 = 15.253 |
6676 /
634 = 10.530 |
| 4 | Debt to
Equity = (Long term debt + Other Liabilities + Current Portion of LTD) / Stockholder's Equity |
41972 /
41495 = 1.011 |
34982 /
35871 = 0.975 |
41454 /
37377 = 1.109 |
40450 /
36196 = 1.117 |
39782 /
38681 = 1.028 |
| 5 | Fixed
Asset Turnover = Net Sales / (Net Plant & Equipment + Other Assets - Escrow Account Amount) |
218623 /
31261 = 6.993 |
179345 /
21667 = 8.277 |
151803 /
32514 = 4.668 |
154458 /
32704 = 4.722 |
119840 /
36392 = 3.293 |
Add Answer to:
Current Ratio
Quick Ratio
Times Interest Earned
Debt to Equity
Fixed Asset Turnover
Compute these ratios...
Current ratio Quick ratio Debt to equity ratio Times interest earned ratio Receivables turnover rati...
 Current ratio
Quick ratio
Debt to equity ratio
Times interest earned ratio
Receivables turnover ratio
Average collection period
Inventory turnover ratio
Average days inventory held
Payables turnover ratio
Average days payables outstanding
Asset turnover ratio
Profit margin on sales
Return on assets (ROA)
Return on shareholders' equity (ROE)
To calculate the above statement using the following
material:
FORD MOTOR COMPANY AND SUBSIDIARIES CONSOLIDATED BALANCE SHEET (in millions) December 31 2018 December 31 2017 ASSETS Cash and cash equivalents (Note 9)...
Current ratio
Quick ratio
Debt to equity ratio
Times interest earned ratio
Receivables turnover ratio
Average collection period
Inventory turnover ratio
Average days inventory held
Payables turnover ratio
Average days payables outstanding
Asset turnover ratio
Profit margin on sales
Return on assets (ROA)
Return on shareholders' equity (ROE)
To calculate the above statement using the following
material:
FORD MOTOR COMPANY AND SUBSIDIARIES CONSOLIDATED BALANCE SHEET (in millions) December 31 2018 December 31 2017 ASSETS Cash and cash equivalents (Note 9)...
Long-term debt ratio Times interest earned Current ratio Quick ratio Cash ratio Inventory turnover Average collection...
 Long-term debt ratio Times interest earned Current ratio Quick ratio Cash ratio Inventory turnover Average collection period 0.6 5.0 73 days Use the above information from the tables to work out the following missing entries, and then calculate the company's return on equity. Note: Turnover and the average collection period are calculated using start-of-year, not average, values. (Enter your answers in millions. Round intermediate calculations and final answers to 2 decimal places.) INCOME STATEMENT (Figures in $ millions) Net sales...
Compute Financial ratios: Price-earnings, Cash Dicidend payot, Debt Ratio, Debt-to-Equity, and Times Interest earned Orange Company...
Compute Financial ratios: Price-earnings, Cash Dicidend payot, Debt Ratio, Debt-to-Equity, and Times Interest earned Orange Company Income Statement For the Years Ended December 31 2013 2012 Net sales (all on account) $ 600,000 $ 520,000 Expenses: Cost of Goods Sold $ 415,000 $ 354,000 Selling and administrative $ 120,800 $ 114,600 Interest Expense $ 7,800 $ 6,000 Income Tax Expense $ 18,000 $ 14,000 Total expenses $ 561,600 $ 488,600 Net Income $ 38,400 $ 31,400 Additional Data: 1. The...
What is Sherman, Inc.'s 20X2 times interest earned ratio? a) 22.45 times b) 31.37 times c)...
 What is Sherman, Inc.'s 20X2 times interest earned
ratio?
a) 22.45 times
b) 31.37 times
c) 45.90 times
d) 46.00 times
EXHIBIT A Sherman, Inc. Balance Sheet As of December 31, 20X1 and 20X2 Assets 20X1 20x2 Marketable securities Accounts receivable Inventory Total current set $ 23,000 8,000 68.000 180.000 $277.000 $ 49,000 10.000 92.000 170,000 $321.000 Land Buildings Equipment Accumulated depreciation Total fixed assets (her) Total asset $ 50.000 125,000 170.000 $ 90,000 105.000 115,000 42.000 $268.000 $545.000 $276.000...
What is Sherman, Inc.'s 20X2 times interest earned
ratio?
a) 22.45 times
b) 31.37 times
c) 45.90 times
d) 46.00 times
EXHIBIT A Sherman, Inc. Balance Sheet As of December 31, 20X1 and 20X2 Assets 20X1 20x2 Marketable securities Accounts receivable Inventory Total current set $ 23,000 8,000 68.000 180.000 $277.000 $ 49,000 10.000 92.000 170,000 $321.000 Land Buildings Equipment Accumulated depreciation Total fixed assets (her) Total asset $ 50.000 125,000 170.000 $ 90,000 105.000 115,000 42.000 $268.000 $545.000 $276.000...
I need someone to calculate the 2019 current ratio, quick ratio, times interest earned ratio, and...
 I need someone to calculate the 2019 current ratio, quick ratio,
times interest earned ratio, and return on stockholders equity with
the 2 statements i have screenshotted.
WP A.7 WHEELS-4-U CORPORATION CONSOLIDATED BALANCE SHEETS ($000 except share data) 12/31/20x9 12/31/20x8 ASSETS Current Assets: Cash and cash equivalents Accounts and other receivables, net Inventories Deferred income tax assets Prepaid expenses Total current assets Property, plant, and Equipment, at cost: Land and land improvements Buildings and building improvements Machinery and equipment Office...
I need someone to calculate the 2019 current ratio, quick ratio,
times interest earned ratio, and return on stockholders equity with
the 2 statements i have screenshotted.
WP A.7 WHEELS-4-U CORPORATION CONSOLIDATED BALANCE SHEETS ($000 except share data) 12/31/20x9 12/31/20x8 ASSETS Current Assets: Cash and cash equivalents Accounts and other receivables, net Inventories Deferred income tax assets Prepaid expenses Total current assets Property, plant, and Equipment, at cost: Land and land improvements Buildings and building improvements Machinery and equipment Office...
Requirements 1. Compute the following ratios for 2018 and 2017: a. Current ratio b. Cash ratio c. Times-interest-earned...
 Requirements 1. Compute the following ratios for 2018 and 2017: a. Current ratio b. Cash ratio c. Times-interest-earned ratio d. Inventory turnover e. Gross profit percentage f. Debt to equity ratio g. Rate of return on common stockholders' equity h. Earnings per share of common stock I. Pricelearnings ratio 2. Decide (a) whether Tanfield's ability to pay debts and to sell inventory improved or deteriorated during 2018 and (b) whether the investment attractiveness of its common stock appears to have...
Leverage Ratios: 11. Debt to Assets ratio 12. Debt to Equity Ratio 13. Times Interest Earned...
 Leverage Ratios: 11. Debt to Assets ratio 12. Debt to Equity Ratio 13. Times Interest Earned Exhibit 1 Paint Cost Sheet: Inner-City Paint Corporation 5 Gallons 5 5 Gallons Sales price Direct material Pail and lid Direct labor Manufacturing overheard ($1/gallon) Gross margin Gross profit ratio $ 27.45 (12.00) (1.72) (2.50) (5.00) $ 6.23 $ 182.75 (132.00) (8.35) (13.75) (5.00) $ 23.65 19.9% 22.7% 32.050 $294.365 Exhibit 2 Balance Sheet for the Current Year Ending June 30: Inner-City Paint Corporation...
Long-term debt ratio 0.1 Times interest earned 8.0 Current ratio 1.2 Quick ratio 1.0 Cash ratio...
Long-term debt ratio 0.1 Times interest earned 8.0 Current ratio 1.2 Quick ratio 1.0 Cash ratio 0.6 Inventory turnover 3.0 Average collection period 73 days Use the above information from the tables to work out the following missing entries, and then calculate the company’s return on equity. Note: Turnover and the average collection period are calculated using start-of-year, not average, values. (Enter your answers in millions. Round intermediate calculations and final answers to 2 decimal places.) INCOME STATEMENT (Figures in...
Long-term debt ratio 0.2 Times interest earned 8.0 Current ratio 1.5 Quick ratio 1.0 Cash ratio...
Long-term debt ratio 0.2 Times interest earned 8.0 Current ratio 1.5 Quick ratio 1.0 Cash ratio 0.9 Inventory turnover 4.0 Average collection period 73 days Use the above information from the tables to work out the following missing entries, and then calculate the company’s return on equity. Note: Turnover and the average collection period are calculated using start-of-year, not average, values. (Enter your answers in millions. Round intermediate calculations and final answers to 2 decimal places.) INCOME STATEMENT (Figures in...
1) the times interest earned ratio 2) the debt to equity ratio 3) the gross margin...
 1) the times interest earned ratio
2) the debt to equity ratio
3) the gross margin percentage
4) the return on total assets (total assets at the beginning
of last hear were 13,070,000)
5) the return on equity(stockholders equity at the beginning
of last year totaled 7,990,250)
no change in common stock over two years
6) ks the companys financial leverage positive ir
negative?
$ 960.000 2,700.000 3.600.000 260.000 7.520.000 9.520.000 $17,040,000 $ 1.200.000 300,000 1.800.000 2.000.000 200.000 5,500,000 9.050.000...
1) the times interest earned ratio
2) the debt to equity ratio
3) the gross margin percentage
4) the return on total assets (total assets at the beginning
of last hear were 13,070,000)
5) the return on equity(stockholders equity at the beginning
of last year totaled 7,990,250)
no change in common stock over two years
6) ks the companys financial leverage positive ir
negative?
$ 960.000 2,700.000 3.600.000 260.000 7.520.000 9.520.000 $17,040,000 $ 1.200.000 300,000 1.800.000 2.000.000 200.000 5,500,000 9.050.000...
 Current ratio
Quick ratio
Debt to equity ratio
Times interest earned ratio
Receivables turnover ratio
Average collection period
Inventory turnover ratio
Average days inventory held
Payables turnover ratio
Average days payables outstanding
Asset turnover ratio
Profit margin on sales
Return on assets (ROA)
Return on shareholders' equity (ROE)
To calculate the above statement using the following
material:
FORD MOTOR COMPANY AND SUBSIDIARIES CONSOLIDATED BALANCE SHEET (in millions) December 31 2018 December 31 2017 ASSETS Cash and cash equivalents (Note 9)...
Current ratio
Quick ratio
Debt to equity ratio
Times interest earned ratio
Receivables turnover ratio
Average collection period
Inventory turnover ratio
Average days inventory held
Payables turnover ratio
Average days payables outstanding
Asset turnover ratio
Profit margin on sales
Return on assets (ROA)
Return on shareholders' equity (ROE)
To calculate the above statement using the following
material:
FORD MOTOR COMPANY AND SUBSIDIARIES CONSOLIDATED BALANCE SHEET (in millions) December 31 2018 December 31 2017 ASSETS Cash and cash equivalents (Note 9)...
 Long-term debt ratio Times interest earned Current ratio Quick ratio Cash ratio Inventory turnover Average collection period 0.6 5.0 73 days Use the above information from the tables to work out the following missing entries, and then calculate the company's return on equity. Note: Turnover and the average collection period are calculated using start-of-year, not average, values. (Enter your answers in millions. Round intermediate calculations and final answers to 2 decimal places.) INCOME STATEMENT (Figures in $ millions) Net sales...
 What is Sherman, Inc.'s 20X2 times interest earned
ratio?
a) 22.45 times
b) 31.37 times
c) 45.90 times
d) 46.00 times
EXHIBIT A Sherman, Inc. Balance Sheet As of December 31, 20X1 and 20X2 Assets 20X1 20x2 Marketable securities Accounts receivable Inventory Total current set $ 23,000 8,000 68.000 180.000 $277.000 $ 49,000 10.000 92.000 170,000 $321.000 Land Buildings Equipment Accumulated depreciation Total fixed assets (her) Total asset $ 50.000 125,000 170.000 $ 90,000 105.000 115,000 42.000 $268.000 $545.000 $276.000...
What is Sherman, Inc.'s 20X2 times interest earned
ratio?
a) 22.45 times
b) 31.37 times
c) 45.90 times
d) 46.00 times
EXHIBIT A Sherman, Inc. Balance Sheet As of December 31, 20X1 and 20X2 Assets 20X1 20x2 Marketable securities Accounts receivable Inventory Total current set $ 23,000 8,000 68.000 180.000 $277.000 $ 49,000 10.000 92.000 170,000 $321.000 Land Buildings Equipment Accumulated depreciation Total fixed assets (her) Total asset $ 50.000 125,000 170.000 $ 90,000 105.000 115,000 42.000 $268.000 $545.000 $276.000...
 I need someone to calculate the 2019 current ratio, quick ratio,
times interest earned ratio, and return on stockholders equity with
the 2 statements i have screenshotted.
WP A.7 WHEELS-4-U CORPORATION CONSOLIDATED BALANCE SHEETS ($000 except share data) 12/31/20x9 12/31/20x8 ASSETS Current Assets: Cash and cash equivalents Accounts and other receivables, net Inventories Deferred income tax assets Prepaid expenses Total current assets Property, plant, and Equipment, at cost: Land and land improvements Buildings and building improvements Machinery and equipment Office...
I need someone to calculate the 2019 current ratio, quick ratio,
times interest earned ratio, and return on stockholders equity with
the 2 statements i have screenshotted.
WP A.7 WHEELS-4-U CORPORATION CONSOLIDATED BALANCE SHEETS ($000 except share data) 12/31/20x9 12/31/20x8 ASSETS Current Assets: Cash and cash equivalents Accounts and other receivables, net Inventories Deferred income tax assets Prepaid expenses Total current assets Property, plant, and Equipment, at cost: Land and land improvements Buildings and building improvements Machinery and equipment Office...
 Requirements 1. Compute the following ratios for 2018 and 2017: a. Current ratio b. Cash ratio c. Times-interest-earned ratio d. Inventory turnover e. Gross profit percentage f. Debt to equity ratio g. Rate of return on common stockholders' equity h. Earnings per share of common stock I. Pricelearnings ratio 2. Decide (a) whether Tanfield's ability to pay debts and to sell inventory improved or deteriorated during 2018 and (b) whether the investment attractiveness of its common stock appears to have...
 Leverage Ratios: 11. Debt to Assets ratio 12. Debt to Equity Ratio 13. Times Interest Earned Exhibit 1 Paint Cost Sheet: Inner-City Paint Corporation 5 Gallons 5 5 Gallons Sales price Direct material Pail and lid Direct labor Manufacturing overheard ($1/gallon) Gross margin Gross profit ratio $ 27.45 (12.00) (1.72) (2.50) (5.00) $ 6.23 $ 182.75 (132.00) (8.35) (13.75) (5.00) $ 23.65 19.9% 22.7% 32.050 $294.365 Exhibit 2 Balance Sheet for the Current Year Ending June 30: Inner-City Paint Corporation...
 1) the times interest earned ratio
2) the debt to equity ratio
3) the gross margin percentage
4) the return on total assets (total assets at the beginning
of last hear were 13,070,000)
5) the return on equity(stockholders equity at the beginning
of last year totaled 7,990,250)
no change in common stock over two years
6) ks the companys financial leverage positive ir
negative?
$ 960.000 2,700.000 3.600.000 260.000 7.520.000 9.520.000 $17,040,000 $ 1.200.000 300,000 1.800.000 2.000.000 200.000 5,500,000 9.050.000...
1) the times interest earned ratio
2) the debt to equity ratio
3) the gross margin percentage
4) the return on total assets (total assets at the beginning
of last hear were 13,070,000)
5) the return on equity(stockholders equity at the beginning
of last year totaled 7,990,250)
no change in common stock over two years
6) ks the companys financial leverage positive ir
negative?
$ 960.000 2,700.000 3.600.000 260.000 7.520.000 9.520.000 $17,040,000 $ 1.200.000 300,000 1.800.000 2.000.000 200.000 5,500,000 9.050.000...
Most questions answered within 3 hours.
-
Where is the error in this code sequence?
String s1 = "Hello";
String s2 = "ello";...
asked 10 months ago -
Financial data for Joel de Paris, Inc., for last year
follow:
Joel de Paris, Inc.
Balance...
asked 10 months ago -
Consider this reaction:
Al2(SO4)3 (aq)+ BaCl3
(aq) Al2Cl6 (aq)- +
3BaSO4(s) . What is the...
asked 10 months ago -
Suppose that Savneet is considering increasing her
recent random sample from 20 car rentals to 40...
asked 10 months ago -
Trucks arrive at an unloading terminal at an average rate of 120
per hour.
Trucks arrive...
asked 10 months ago -
Why are methanol and ethanol completely soluble in water while
octanol is not very little soluble....
asked 10 months ago -
A facilities manager at a university reads in a research report
that the mean amount of...
asked 10 months ago -
When the CuSO4 is rehydrated by adding water to the anhydrous
compound, is this an endothermic...
asked 10 months ago -
A ray of sunlight is passing from diamond into crown glass; the
angle of incidence is...
asked 10 months ago -
A block of mass 0.249 kg is placed on top of a light, vertical
spring of...
asked 10 months ago -
how do the kidneys compensate in the presences of acidosis
a) trigger hyperventilate
b) reserve acid...
asked 10 months ago -
Question 501 pts
The rental rate of capital to the firm increases. Which of the
following...
asked 10 months ago