
Homework Answers
Add Answer to:
2. Consider the histogram of a randomly selected sample is given below: 14 12 10 8...
I. The data below set represents the scores of 12 randomly selected students on the SAT...
 I. The data below set represents the scores of 12 randomly selected students on the SAT Physics Subject Test. Assume the population test scores are normally distributed and the population standard deviation is 104. 590 450 490 680 380 500 570 620 640 530 780 720 /2 (a) Find the point estimate of the population mean. (b) Construct a 90% confidence interval for the population mean. Interpret the results. (c) Does it seem possible that the population mean could equal...
3. Scores of 12 randomly selected exams in a statistic class are given below: 98 78...
 3. Scores of 12 randomly selected exams in a statistic class are given below: 98 78 90 70 80 55 78 77 70 80 78 86 (a) (6 points) Find the mean and standard deviation. Round your answer to a whole number. It has been reported that the mean score of all statistics exams is below 80. Test the validity of the report at a = 0.02 by using the data given above. (b) (4 points) Clearly state H, and...
4. Scores of 10 randomly selected exams in a statistic class are given below: 98 78...
 4. Scores of 10 randomly selected exams in a statistic class are given below: 98 78 90 70 80 55 78 77 70 80 (a) (4 points) Find the mean and standard deviation. Round your answer to a whole number. (a) It has been reported that the mean score of all statistics exams is greater than 75. Test the validity of the report at a = 0.02 by using the data given above. (b) (4 points) Clearly state H, and...
Question 4 (10 points) Suppose a new standardized test is given to 100 randomly selected third-...
 Question 4 (10 points) Suppose a new standardized test is given to 100 randomly selected third- on the test is 58, and the grade students in New Jersey. The sample average score sample standard deviation, sy, is 8. evel. (a) Test Ho : μY-60 vs H1 : μYメ60 at a 1% significance (b) Construct a 90% confidence interval for the mean score of all New Jersey third graders (c) Suppose the same test is given to 200 randomly selected third...
price earning ratios of 100randomly selected shares are: please find a) mean and b) standard deviation...
 price earning ratios of 100randomly selected shares are:
please find a) mean and b) standard deviation
Interval -0.5-4.5 4.5-9.5 9.5 - 14.5 14.5 - 19.5 19.5 - 24.5 24.5 - 29.5 29.5 - 34.5 Frequency 11 48 25 10 1 3 2
price earning ratios of 100randomly selected shares are:
please find a) mean and b) standard deviation
Interval -0.5-4.5 4.5-9.5 9.5 - 14.5 14.5 - 19.5 19.5 - 24.5 24.5 - 29.5 29.5 - 34.5 Frequency 11 48 25 10 1 3 2
A sample of size 49 is randomly selected from a population with a mean, 25 and...
A sample of size 49 is randomly selected from a population with a mean, 25 and standard deviation, 14. Find P(X-bar > 26) a .8413 b .3085 c .1357 d .5279
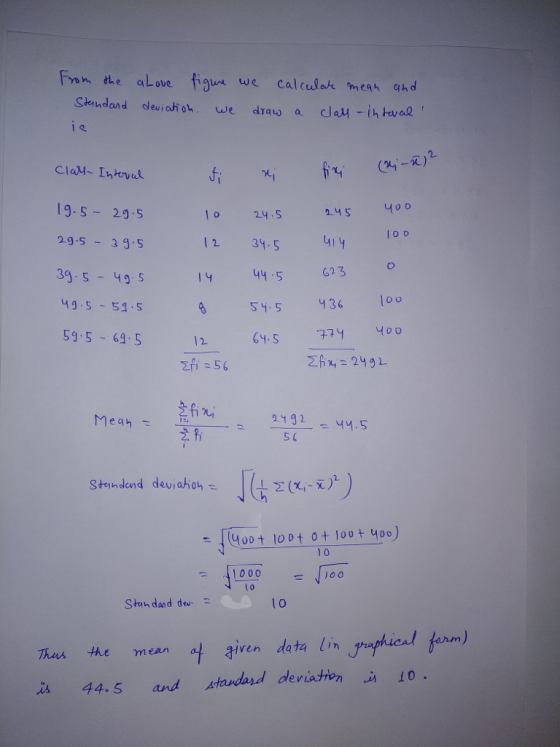
Consider the following frequency table. Minutes Frequency 4.5-9.5 8 9.5-14.5 12 14.5-19.5 19 19.5-24.5 7 24.5-29.5...
Consider the following frequency table. Minutes Frequency 4.5-9.5 8 9.5-14.5 12 14.5-19.5 19 19.5-24.5 7 24.5-29.5 3 a. Compute the mean. Round your answer to two decimal places. b. Compute the standard deviation. Round your answer to two decimal places.
I feel test for a new exam was given to randomly selected seniors the exam was...
 I
feel test for a new exam was given to randomly selected seniors the
exam was graded and then sample mean and simple standard deviation
we are calculated based on the results of the exam creator claims
that on the same exam nine times out of 10 the seniors will have an
average score within 3% and 70% of the coefficients interval was
90% 95% of 99% what is the margin of error calculate the confidence
interval and explain what...
I
feel test for a new exam was given to randomly selected seniors the
exam was graded and then sample mean and simple standard deviation
we are calculated based on the results of the exam creator claims
that on the same exam nine times out of 10 the seniors will have an
average score within 3% and 70% of the coefficients interval was
90% 95% of 99% what is the margin of error calculate the confidence
interval and explain what...
A sample of 14 randomly selected commuters in Chicago showed the average of the commuting times...
A sample of 14 randomly selected commuters in Chicago showed the average of the commuting times was 33.2 minutes. If the standard decision was 8.3 minutes, find the confidence interval of the true mean.
(2) Consider the sample: 9, 6. 7, 9, 10, 8 a) Find: the mean, the median,...
 (2) Consider the sample: 9, 6. 7, 9, 10, 8 a) Find: the mean, the median, the mode b) Find: the range, the quartiles Q1, Q3, the variance, the standard deviation c) Draw a box-plot for the given data set.
 I. The data below set represents the scores of 12 randomly selected students on the SAT Physics Subject Test. Assume the population test scores are normally distributed and the population standard deviation is 104. 590 450 490 680 380 500 570 620 640 530 780 720 /2 (a) Find the point estimate of the population mean. (b) Construct a 90% confidence interval for the population mean. Interpret the results. (c) Does it seem possible that the population mean could equal...
 3. Scores of 12 randomly selected exams in a statistic class are given below: 98 78 90 70 80 55 78 77 70 80 78 86 (a) (6 points) Find the mean and standard deviation. Round your answer to a whole number. It has been reported that the mean score of all statistics exams is below 80. Test the validity of the report at a = 0.02 by using the data given above. (b) (4 points) Clearly state H, and...
 4. Scores of 10 randomly selected exams in a statistic class are given below: 98 78 90 70 80 55 78 77 70 80 (a) (4 points) Find the mean and standard deviation. Round your answer to a whole number. (a) It has been reported that the mean score of all statistics exams is greater than 75. Test the validity of the report at a = 0.02 by using the data given above. (b) (4 points) Clearly state H, and...
 Question 4 (10 points) Suppose a new standardized test is given to 100 randomly selected third- on the test is 58, and the grade students in New Jersey. The sample average score sample standard deviation, sy, is 8. evel. (a) Test Ho : μY-60 vs H1 : μYメ60 at a 1% significance (b) Construct a 90% confidence interval for the mean score of all New Jersey third graders (c) Suppose the same test is given to 200 randomly selected third...
 price earning ratios of 100randomly selected shares are:
please find a) mean and b) standard deviation
Interval -0.5-4.5 4.5-9.5 9.5 - 14.5 14.5 - 19.5 19.5 - 24.5 24.5 - 29.5 29.5 - 34.5 Frequency 11 48 25 10 1 3 2
price earning ratios of 100randomly selected shares are:
please find a) mean and b) standard deviation
Interval -0.5-4.5 4.5-9.5 9.5 - 14.5 14.5 - 19.5 19.5 - 24.5 24.5 - 29.5 29.5 - 34.5 Frequency 11 48 25 10 1 3 2
 I
feel test for a new exam was given to randomly selected seniors the
exam was graded and then sample mean and simple standard deviation
we are calculated based on the results of the exam creator claims
that on the same exam nine times out of 10 the seniors will have an
average score within 3% and 70% of the coefficients interval was
90% 95% of 99% what is the margin of error calculate the confidence
interval and explain what...
I
feel test for a new exam was given to randomly selected seniors the
exam was graded and then sample mean and simple standard deviation
we are calculated based on the results of the exam creator claims
that on the same exam nine times out of 10 the seniors will have an
average score within 3% and 70% of the coefficients interval was
90% 95% of 99% what is the margin of error calculate the confidence
interval and explain what...
 (2) Consider the sample: 9, 6. 7, 9, 10, 8 a) Find: the mean, the median, the mode b) Find: the range, the quartiles Q1, Q3, the variance, the standard deviation c) Draw a box-plot for the given data set.
Most questions answered within 3 hours.
-
Where is the error in this code sequence?
String s1 = "Hello";
String s2 = "ello";...
asked 10 months ago -
Financial data for Joel de Paris, Inc., for last year
follow:
Joel de Paris, Inc.
Balance...
asked 10 months ago -
Consider this reaction:
Al2(SO4)3 (aq)+ BaCl3
(aq) Al2Cl6 (aq)- +
3BaSO4(s) . What is the...
asked 10 months ago -
Suppose that Savneet is considering increasing her
recent random sample from 20 car rentals to 40...
asked 10 months ago -
Trucks arrive at an unloading terminal at an average rate of 120
per hour.
Trucks arrive...
asked 10 months ago -
Why are methanol and ethanol completely soluble in water while
octanol is not very little soluble....
asked 10 months ago -
A facilities manager at a university reads in a research report
that the mean amount of...
asked 10 months ago -
When the CuSO4 is rehydrated by adding water to the anhydrous
compound, is this an endothermic...
asked 10 months ago -
A ray of sunlight is passing from diamond into crown glass; the
angle of incidence is...
asked 10 months ago -
A block of mass 0.249 kg is placed on top of a light, vertical
spring of...
asked 10 months ago -
how do the kidneys compensate in the presences of acidosis
a) trigger hyperventilate
b) reserve acid...
asked 10 months ago -
Question 501 pts
The rental rate of capital to the firm increases. Which of the
following...
asked 10 months ago