
Homework Answers
Add Answer to:
Based on the comparative income statement and balance sheet or Cowakichen Counters, Inc. Comparative Income Statement...
coE Bed on the comparative income statement and balance sheet of Cowan then Counters, Inc, that...
 coE Bed on the comparative income statement and balance sheet of Cowan then Counters, Inc, that follow Analysis of Actvity Measures Cowan Kitchen Counters, Inc. For Years Ended December 31, 20-2 and 20-1 20-2 Comparative Income Statement 20-1 $2,163,000 A,636,800 $546,200 221,800 Net Sales (al on account) $2.584,000 Cost of goods sold Gross profit Operating expenses other expense (interest) Income tax expense L86 200 $715,800 315,200 24,200 176,800 $199,600 24,200 106,300 $193,900 Net income Cowan Kitchen Counters, Inc Comparative Balance...
Analysis of Liquidity Based on the comparative income statement and balance sheet of Cowan Kitchen Counters,...
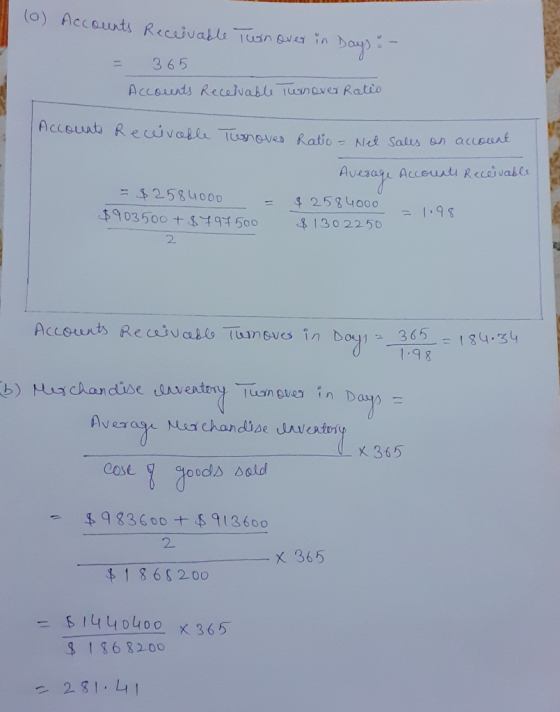
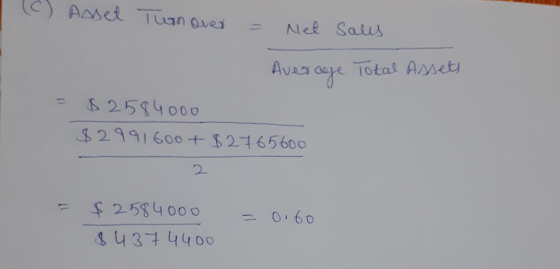
 Analysis of Liquidity Based on the comparative income statement and balance sheet of Cowan Kitchen Counters, Inc., that follow: Cowan Kitchen Counters, Inc. Comparative Income Statement For Years Ended December 31, 20-2 and 20-1 20-2 20-1 Net Sales (all on account) Cost of goods sold Gross profit Operating expenses Other expense (interest) Income tax expense Net income $2,584,000 1,868,200 $715,800 315,200 24,200 176,800 $199,600 $2,163,000 1,616,800 $546,200 221,800 24,200 106,300 $193,900 Comparative Balance Sheet December 31, 20-2 and 20-1 20-2...
Analysis of Activity Measures Based on the comparative income statement and balance sheet of Cowan Kitchen...
 Analysis of Activity Measures Based on the comparative income statement and balance sheet of Cowan Kitchen Counters, Inc., that follow: 20-1 $2,163,000 Cowan Kitchen Counters, Inc. Comparative Income Statement For Years Ended December 31, 20-2 and 20-1 20-2 Net Sales (all on account) $2,584,000 Cost of goods sold 1,868,200 Gross profit $715,800 Operating expenses 315,200 Other expense (interest) 24,200 Income tax expense 176,800 Net income $199,600 1,616,800 $546,200 221,800 24,200 106,300 $193,900 Comparative Balance Sheet December 31, 20-2 and 20-1...
Refer the following table. 2015 $ 37 49 Airspace Technologies Inc. Comparative Balance Sheet Information November...
 Refer the following table. 2015 $ 37 49 Airspace Technologies Inc. Comparative Balance Sheet Information November 30 (millions of $) 2017 2016 Cash $ 74 $ 25 Accounts receivable (net) 123 61 Inventory 205 241 Prepaid rent 85 49 Plant and equipment (net) 850 833 Accounts payable 109 66 Accrued liabilities 133 Income tax payable 30 18 Preferred shares 133 133 Common shares 253 253 Retained earnings 611 567 201 37 829 56 90 133 253 609 Airspace Technologies Inc....
Lendell Company has these comparative balance sheet data: Lendell Company Balance Sheets December 31 2020 2019...
 Lendell Company has these comparative balance sheet data: Lendell Company Balance Sheets December 31 2020 2019 Cash $ 15,000 $ 30,000 Accounts receivable (net) 71,000 60,000 Inventory 61,000 50,000 Plant assets (net) 197,000 175,000 View Policies $344,000 Accounts payable $50,000 $59,200 Mortgage payable (15%) 108,000 108,000 Common stock, $10 par 138,500 124,500 Retained earnings 47,500 23,300 $344,000 $315,000 Additional information for 2020: 1. Net income was $25,700. 2. Sales on account were $412,500. Sales returns and allowances amounted to $19,500....
Problem 4 (20 points) Given below are comparative Balance Sheets and Income Statement for Blaster Corporation:...
 Problem 4 (20 points) Given below are comparative Balance Sheets and Income Statement for Blaster Corporation: Blaster Corporation Income Statement for year ended 31 December 2017 Blaster Corporation Balance Sheets - Year 2017 Dec. 31 Jan. 1 Cash $ 42,500 $ 32,800 Accounts receivable 282,000 234,000 Inventory 196,000 182,000 Sales $1,060,000 Cost of goods sold (698,000) Gross profit $362,000 Equipment (net) 206,000 192,000 Operating expenses (247,000) $726.500 $640,800 Operating income $ 115,000 Accounts payable $164,000 $154,000 and Interest expense income...
Please answer. Refer the following table. Airspace Technologies Inc. Comparative Balance Sheet Information November 30 (millions...
 Please answer.
Refer the following table. Airspace Technologies Inc. Comparative Balance Sheet Information November 30 (millions of S) 2017 2016 2015 Cash $ 73$ 245 36 Accounts receivable 122 6020 (net) Inventory Prepaid rent Plant and equipment (net) Accounts payable Accrued liabilities Income tax payable Preferred shares Common shares Retained earnings Airspace Technologies Inc. Income Statement For Year Ended November 30, 2017 (millions of $) 2017 2016 Net sales $ 1,440 $1,224 Cost of goods sold 516 444 $ 924...
Please answer.
Refer the following table. Airspace Technologies Inc. Comparative Balance Sheet Information November 30 (millions of S) 2017 2016 2015 Cash $ 73$ 245 36 Accounts receivable 122 6020 (net) Inventory Prepaid rent Plant and equipment (net) Accounts payable Accrued liabilities Income tax payable Preferred shares Common shares Retained earnings Airspace Technologies Inc. Income Statement For Year Ended November 30, 2017 (millions of $) 2017 2016 Net sales $ 1,440 $1,224 Cost of goods sold 516 444 $ 924...
The 2018 comparative balance sheet and income statement of Allen Group, Inc. follow. Allen disposed of...
 The 2018 comparative balance sheet and income statement of Allen
Group, Inc. follow. Allen disposed of a plant asset at book value
during 2018
.Prepare the spreadsheet for the 2018 statement of cash flows.
Format cash flows from operating activities by the indirect method.
A plant asset was disposed of for $0. The cost and accumulated
depreciation of the disposed asset was $ 12,600.
There were no sales of land, no retirement of common stock,
and no treasury stock transactions....
The 2018 comparative balance sheet and income statement of Allen
Group, Inc. follow. Allen disposed of a plant asset at book value
during 2018
.Prepare the spreadsheet for the 2018 statement of cash flows.
Format cash flows from operating activities by the indirect method.
A plant asset was disposed of for $0. The cost and accumulated
depreciation of the disposed asset was $ 12,600.
There were no sales of land, no retirement of common stock,
and no treasury stock transactions....
Redlands, Inc. presents the following income statement and balance sheet for 2011. $200 130 Income Statement...
 Redlands, Inc. presents the following income statement and balance sheet for 2011. $200 130 Income Statement Sales revenues Cost of goods sold Gross profit Operating expenses Net income 70 50 20 80 Assets Cash Accounts receivable Inventory Current assets Balance Sheet Liabilities 60 Accounts payable 80 150 Shareholders' Equity 290 Common stock Retained earnings 210 Total S/Equity S500 Total Liabilities and SE Equipment Total assets 240 180 420 S500 Required: Use the income statement and balance sheet data in dollars)...
View Policies Current Attempt in Progress Lendell Company has these comparative balance sheet data: Lendell Company...
 View Policies Current Attempt in Progress Lendell Company has these comparative balance sheet data: Lendell Company Balance Sheets December 31 2020 Cash $15.000 Accounts receivable (net) 70,000 Inventory 61,000 Plant assets (net) 195,000 $341,000 Accounts payable $50,000 Mortgage payable (15%) 101,500 Common stock, $10 par 144,000 Retained earnings 45.500 5341,000 2019 $ 30,000 59.000 49.000 179.000 $317.000 $60.900 101.500 118.500 36.100 $317.000 Additional information for 2020: 1 2 3. - 5. Net income was $25.800. Sales on account were $407,700....
 coE Bed on the comparative income statement and balance sheet of Cowan then Counters, Inc, that follow Analysis of Actvity Measures Cowan Kitchen Counters, Inc. For Years Ended December 31, 20-2 and 20-1 20-2 Comparative Income Statement 20-1 $2,163,000 A,636,800 $546,200 221,800 Net Sales (al on account) $2.584,000 Cost of goods sold Gross profit Operating expenses other expense (interest) Income tax expense L86 200 $715,800 315,200 24,200 176,800 $199,600 24,200 106,300 $193,900 Net income Cowan Kitchen Counters, Inc Comparative Balance...
 Analysis of Liquidity Based on the comparative income statement and balance sheet of Cowan Kitchen Counters, Inc., that follow: Cowan Kitchen Counters, Inc. Comparative Income Statement For Years Ended December 31, 20-2 and 20-1 20-2 20-1 Net Sales (all on account) Cost of goods sold Gross profit Operating expenses Other expense (interest) Income tax expense Net income $2,584,000 1,868,200 $715,800 315,200 24,200 176,800 $199,600 $2,163,000 1,616,800 $546,200 221,800 24,200 106,300 $193,900 Comparative Balance Sheet December 31, 20-2 and 20-1 20-2...
 Analysis of Activity Measures Based on the comparative income statement and balance sheet of Cowan Kitchen Counters, Inc., that follow: 20-1 $2,163,000 Cowan Kitchen Counters, Inc. Comparative Income Statement For Years Ended December 31, 20-2 and 20-1 20-2 Net Sales (all on account) $2,584,000 Cost of goods sold 1,868,200 Gross profit $715,800 Operating expenses 315,200 Other expense (interest) 24,200 Income tax expense 176,800 Net income $199,600 1,616,800 $546,200 221,800 24,200 106,300 $193,900 Comparative Balance Sheet December 31, 20-2 and 20-1...
 Refer the following table. 2015 $ 37 49 Airspace Technologies Inc. Comparative Balance Sheet Information November 30 (millions of $) 2017 2016 Cash $ 74 $ 25 Accounts receivable (net) 123 61 Inventory 205 241 Prepaid rent 85 49 Plant and equipment (net) 850 833 Accounts payable 109 66 Accrued liabilities 133 Income tax payable 30 18 Preferred shares 133 133 Common shares 253 253 Retained earnings 611 567 201 37 829 56 90 133 253 609 Airspace Technologies Inc....
 Lendell Company has these comparative balance sheet data: Lendell Company Balance Sheets December 31 2020 2019 Cash $ 15,000 $ 30,000 Accounts receivable (net) 71,000 60,000 Inventory 61,000 50,000 Plant assets (net) 197,000 175,000 View Policies $344,000 Accounts payable $50,000 $59,200 Mortgage payable (15%) 108,000 108,000 Common stock, $10 par 138,500 124,500 Retained earnings 47,500 23,300 $344,000 $315,000 Additional information for 2020: 1. Net income was $25,700. 2. Sales on account were $412,500. Sales returns and allowances amounted to $19,500....
 Problem 4 (20 points) Given below are comparative Balance Sheets and Income Statement for Blaster Corporation: Blaster Corporation Income Statement for year ended 31 December 2017 Blaster Corporation Balance Sheets - Year 2017 Dec. 31 Jan. 1 Cash $ 42,500 $ 32,800 Accounts receivable 282,000 234,000 Inventory 196,000 182,000 Sales $1,060,000 Cost of goods sold (698,000) Gross profit $362,000 Equipment (net) 206,000 192,000 Operating expenses (247,000) $726.500 $640,800 Operating income $ 115,000 Accounts payable $164,000 $154,000 and Interest expense income...
 Please answer.
Refer the following table. Airspace Technologies Inc. Comparative Balance Sheet Information November 30 (millions of S) 2017 2016 2015 Cash $ 73$ 245 36 Accounts receivable 122 6020 (net) Inventory Prepaid rent Plant and equipment (net) Accounts payable Accrued liabilities Income tax payable Preferred shares Common shares Retained earnings Airspace Technologies Inc. Income Statement For Year Ended November 30, 2017 (millions of $) 2017 2016 Net sales $ 1,440 $1,224 Cost of goods sold 516 444 $ 924...
Please answer.
Refer the following table. Airspace Technologies Inc. Comparative Balance Sheet Information November 30 (millions of S) 2017 2016 2015 Cash $ 73$ 245 36 Accounts receivable 122 6020 (net) Inventory Prepaid rent Plant and equipment (net) Accounts payable Accrued liabilities Income tax payable Preferred shares Common shares Retained earnings Airspace Technologies Inc. Income Statement For Year Ended November 30, 2017 (millions of $) 2017 2016 Net sales $ 1,440 $1,224 Cost of goods sold 516 444 $ 924...
 The 2018 comparative balance sheet and income statement of Allen
Group, Inc. follow. Allen disposed of a plant asset at book value
during 2018
.Prepare the spreadsheet for the 2018 statement of cash flows.
Format cash flows from operating activities by the indirect method.
A plant asset was disposed of for $0. The cost and accumulated
depreciation of the disposed asset was $ 12,600.
There were no sales of land, no retirement of common stock,
and no treasury stock transactions....
The 2018 comparative balance sheet and income statement of Allen
Group, Inc. follow. Allen disposed of a plant asset at book value
during 2018
.Prepare the spreadsheet for the 2018 statement of cash flows.
Format cash flows from operating activities by the indirect method.
A plant asset was disposed of for $0. The cost and accumulated
depreciation of the disposed asset was $ 12,600.
There were no sales of land, no retirement of common stock,
and no treasury stock transactions....
 Redlands, Inc. presents the following income statement and balance sheet for 2011. $200 130 Income Statement Sales revenues Cost of goods sold Gross profit Operating expenses Net income 70 50 20 80 Assets Cash Accounts receivable Inventory Current assets Balance Sheet Liabilities 60 Accounts payable 80 150 Shareholders' Equity 290 Common stock Retained earnings 210 Total S/Equity S500 Total Liabilities and SE Equipment Total assets 240 180 420 S500 Required: Use the income statement and balance sheet data in dollars)...
 View Policies Current Attempt in Progress Lendell Company has these comparative balance sheet data: Lendell Company Balance Sheets December 31 2020 Cash $15.000 Accounts receivable (net) 70,000 Inventory 61,000 Plant assets (net) 195,000 $341,000 Accounts payable $50,000 Mortgage payable (15%) 101,500 Common stock, $10 par 144,000 Retained earnings 45.500 5341,000 2019 $ 30,000 59.000 49.000 179.000 $317.000 $60.900 101.500 118.500 36.100 $317.000 Additional information for 2020: 1 2 3. - 5. Net income was $25.800. Sales on account were $407,700....
Most questions answered within 3 hours.
-
Where is the error in this code sequence?
String s1 = "Hello";
String s2 = "ello";...
asked 10 months ago -
Financial data for Joel de Paris, Inc., for last year
follow:
Joel de Paris, Inc.
Balance...
asked 10 months ago -
Consider this reaction:
Al2(SO4)3 (aq)+ BaCl3
(aq) Al2Cl6 (aq)- +
3BaSO4(s) . What is the...
asked 10 months ago -
Suppose that Savneet is considering increasing her
recent random sample from 20 car rentals to 40...
asked 10 months ago -
Trucks arrive at an unloading terminal at an average rate of 120
per hour.
Trucks arrive...
asked 10 months ago -
Why are methanol and ethanol completely soluble in water while
octanol is not very little soluble....
asked 10 months ago -
A facilities manager at a university reads in a research report
that the mean amount of...
asked 10 months ago -
When the CuSO4 is rehydrated by adding water to the anhydrous
compound, is this an endothermic...
asked 10 months ago -
A ray of sunlight is passing from diamond into crown glass; the
angle of incidence is...
asked 10 months ago -
A block of mass 0.249 kg is placed on top of a light, vertical
spring of...
asked 10 months ago -
how do the kidneys compensate in the presences of acidosis
a) trigger hyperventilate
b) reserve acid...
asked 10 months ago -
Question 501 pts
The rental rate of capital to the firm increases. Which of the
following...
asked 10 months ago