


Homework Answers
As HOMEWORKLIB answering guideline i have answered the first four subparts only
a)
option c
-------------------------------------------------------------------
I hve used minitab software fro the rest parts
b) Steps
- Enter the data

- Stat-basic statistics-correlation

- ok


minitab output

Hence the correlation is 0.945
--------------------------------------------------------------------------------------------------------------
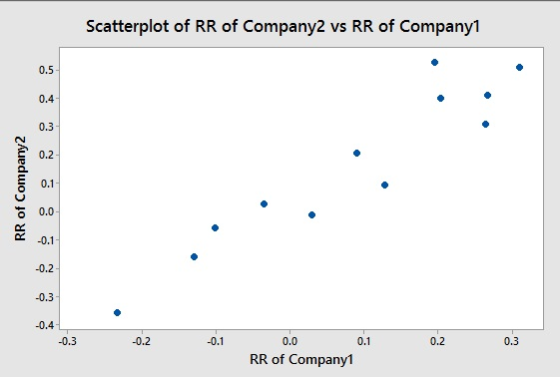
c) As there exists strong postive correlation hence there exists linear relation ship
YES
----------------------------------------------------------------------------------------------------------
d)Steps
- Enter the data

- Stat-regression-regression-fit regression model
-
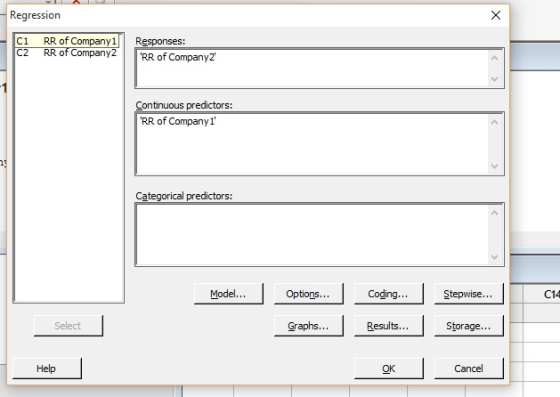
- ok


minitab output

the regression equation

---------------------------------
PLEASE UPVOTE IF YOU LIKE MY ANSWER
THANK YOU
Add Answer to:
The accompanying data represent the annual rates of return of two companies' stock for the past...
please answer parts (e) through (i) , thanks! (e) Predict the rate of return of Company...
 please answer parts (e) through (i) , thanks!
(e) Predict the rate of return of Company 2 if the rate of return of Company 1 is 0.1 (10%). The rate of return of Company 2 will be Round to four decimall places as needed.) f If the actual rate of return for Company 2 was 13.1% when the rate of return of Company 1 was 10%, was the performance of Company 2 above or below average among all eare the...
please answer parts (e) through (i) , thanks!
(e) Predict the rate of return of Company 2 if the rate of return of Company 1 is 0.1 (10%). The rate of return of Company 2 will be Round to four decimall places as needed.) f If the actual rate of return for Company 2 was 13.1% when the rate of return of Company 1 was 10%, was the performance of Company 2 above or below average among all eare the...
The data in the accompanying table represent the rate of return of a certain company stock...
 The
data in the accompanying table represent the rate of return of a
certain company stock for 11 months, compared with the rate of
return of a certain index of 500 stocks.
Assuming the residuals are normally distributed, test whether
linear relation exist between the rate of return of the index, x,
And the rate of return for the company stock, y, at the a=0.10
level of significance.
in Month Apr-18 May-18 Jun-18 Jul-18 Aug-18 Sept-18 Oct-18 Nov-18 Dec-18 Jan-19...
The
data in the accompanying table represent the rate of return of a
certain company stock for 11 months, compared with the rate of
return of a certain index of 500 stocks.
Assuming the residuals are normally distributed, test whether
linear relation exist between the rate of return of the index, x,
And the rate of return for the company stock, y, at the a=0.10
level of significance.
in Month Apr-18 May-18 Jun-18 Jul-18 Aug-18 Sept-18 Oct-18 Nov-18 Dec-18 Jan-19...
Please solve for (a)-(d) below. The data in the accompanying table represent the rate of return...
 Please solve for (a)-(d)
below. The data in the accompanying table represent the rate of return of a certain company stock for 11 months, compared with the rate of return of a certain index of 500 stocks. Both are in percent. Complete parts (a) through Click the icon to view the data table. (a) Treating the rate of return of the index as the explanatory variable, x, use technology to determine the estimates of Bo and B1 The estimate of...
Please solve for (a)-(d)
below. The data in the accompanying table represent the rate of return of a certain company stock for 11 months, compared with the rate of return of a certain index of 500 stocks. Both are in percent. Complete parts (a) through Click the icon to view the data table. (a) Treating the rate of return of the index as the explanatory variable, x, use technology to determine the estimates of Bo and B1 The estimate of...
The accompanying data represent the weights of various domestic cars and their gas mileages in the...
 The accompanying data represent the weights of various domestic cars and their gas mileages in the city. The linear correlation coefficient between the weight of a car and its miles per gallon in the city is r= -0.974. The least-squares regression line treating weight as the explanatory variable and miles per gallon as the response variable is y = -0.0066x + 43.3298. Complete parts (a) through (c) below. E:: Click the icon to view the data table. (a) What proportion...
The accompanying data represent the number of days absent, x, and the final exam score, y,...
 The accompanying data represent the number of days absent, x, and the final exam score, y, for a sample of college students in a general education course at a large state university. Complete parts (a) through (e) below. B: Click the icon to view the absence count and final exam score data Click the icon to view a table of critical values for the correlation coefficient. (a) Find the least squares regression line treating number of absences as the explanatory...
The accompanying data represent the weights of various domestic cars and their gas mileages in the...
The accompanying data represent the weights of various domestic cars and their gas mileages in the city. The linear correlation coefficient between the weight of a car and its miles per gallon in the city is r = −0.978. The least-squares regression line treating weight as the explanatory variable and miles per gallon as the response variable is ŷ=−0.0067x+43.2680. Car Weight (pounds), x Miles per Gallon, y 1 3,765 18 2 3,984 17 3 3,530 21 4 3,175 23 5 ...
The accompanying data represent the total compensation for 12 randomly selected chief executive officers (CEO) and...
 The accompanying data represent the total compensation for 12 randomly selected chief executive officers (CEO) and the company's stock performance in a recent year. Complete parts (a) through (d) below. Click the icon to view the CEO data. (a) One would think that a higher stock return would lead to a higher compensation. Based on this, what would likely be the explanatory variable? Stock return Compensation (b) Draw a scatter diagram of the data. Use the result from part (a)...
The accompanying data represent the total compensation for 12 randomly selected chief executive officers (CEO) and...
 The accompanying data represent the total compensation for 12 randomly selected chief executive officers (CEO) and the company's stock performance in a recent year. Complete parts (a) through (d) below. Click the icon to view the CEO data. (a) One would think that a higher stock return would lead to a higher compensation. Based on this, what would likely be the explanatory variable? O O Stock return Compensation (b) Draw a scatter diagram of the data. Use the result from...
Use the Regression tool on the accompanying wedding data, using the wedding cost as the dependent...
 Use the Regression tool on the accompanying wedding data, using the wedding cost as the dependent variable and attendance as the independent variable. Complete parts a through c. Click the icon to view the wedding data. a. What is the regression model? Wedding Cost =+Attendance (Round to three decimal places as needed.) b. Interpret all key regression results, hypothesis tests, and confidence intervals in the regression output from part a. Interpret the slope of the regression equation. Choose the correct...
i Rate of Return Month Rates of return of the Rates of return of the index,...
 i Rate of Return Month Rates of return of the Rates of return of the index, x company stock, y Apr-07 4.23 3.38 May-07 3.25 5.09 Jun-07 - 1.78 0.54 -3.20 2.88 Jul-07 Aug-07 1.29 2.69 Sept-07 3.58 7.41 1.48 -4.83 Oct-07 -4.40 -2.38 Nov-07 2.37 Dec-07 -0.86 -6.12 -4.27 Jan-08 -3.48 Feb-08 -3.77 X The data in the accompanying table represent the rate of return of a certain company stock for 11 months, compared with the rate of return...
 please answer parts (e) through (i) , thanks!
(e) Predict the rate of return of Company 2 if the rate of return of Company 1 is 0.1 (10%). The rate of return of Company 2 will be Round to four decimall places as needed.) f If the actual rate of return for Company 2 was 13.1% when the rate of return of Company 1 was 10%, was the performance of Company 2 above or below average among all eare the...
please answer parts (e) through (i) , thanks!
(e) Predict the rate of return of Company 2 if the rate of return of Company 1 is 0.1 (10%). The rate of return of Company 2 will be Round to four decimall places as needed.) f If the actual rate of return for Company 2 was 13.1% when the rate of return of Company 1 was 10%, was the performance of Company 2 above or below average among all eare the...
 The
data in the accompanying table represent the rate of return of a
certain company stock for 11 months, compared with the rate of
return of a certain index of 500 stocks.
Assuming the residuals are normally distributed, test whether
linear relation exist between the rate of return of the index, x,
And the rate of return for the company stock, y, at the a=0.10
level of significance.
in Month Apr-18 May-18 Jun-18 Jul-18 Aug-18 Sept-18 Oct-18 Nov-18 Dec-18 Jan-19...
The
data in the accompanying table represent the rate of return of a
certain company stock for 11 months, compared with the rate of
return of a certain index of 500 stocks.
Assuming the residuals are normally distributed, test whether
linear relation exist between the rate of return of the index, x,
And the rate of return for the company stock, y, at the a=0.10
level of significance.
in Month Apr-18 May-18 Jun-18 Jul-18 Aug-18 Sept-18 Oct-18 Nov-18 Dec-18 Jan-19...
 Please solve for (a)-(d)
below. The data in the accompanying table represent the rate of return of a certain company stock for 11 months, compared with the rate of return of a certain index of 500 stocks. Both are in percent. Complete parts (a) through Click the icon to view the data table. (a) Treating the rate of return of the index as the explanatory variable, x, use technology to determine the estimates of Bo and B1 The estimate of...
Please solve for (a)-(d)
below. The data in the accompanying table represent the rate of return of a certain company stock for 11 months, compared with the rate of return of a certain index of 500 stocks. Both are in percent. Complete parts (a) through Click the icon to view the data table. (a) Treating the rate of return of the index as the explanatory variable, x, use technology to determine the estimates of Bo and B1 The estimate of...
 The accompanying data represent the weights of various domestic cars and their gas mileages in the city. The linear correlation coefficient between the weight of a car and its miles per gallon in the city is r= -0.974. The least-squares regression line treating weight as the explanatory variable and miles per gallon as the response variable is y = -0.0066x + 43.3298. Complete parts (a) through (c) below. E:: Click the icon to view the data table. (a) What proportion...
 The accompanying data represent the number of days absent, x, and the final exam score, y, for a sample of college students in a general education course at a large state university. Complete parts (a) through (e) below. B: Click the icon to view the absence count and final exam score data Click the icon to view a table of critical values for the correlation coefficient. (a) Find the least squares regression line treating number of absences as the explanatory...
 The accompanying data represent the total compensation for 12 randomly selected chief executive officers (CEO) and the company's stock performance in a recent year. Complete parts (a) through (d) below. Click the icon to view the CEO data. (a) One would think that a higher stock return would lead to a higher compensation. Based on this, what would likely be the explanatory variable? Stock return Compensation (b) Draw a scatter diagram of the data. Use the result from part (a)...
 The accompanying data represent the total compensation for 12 randomly selected chief executive officers (CEO) and the company's stock performance in a recent year. Complete parts (a) through (d) below. Click the icon to view the CEO data. (a) One would think that a higher stock return would lead to a higher compensation. Based on this, what would likely be the explanatory variable? O O Stock return Compensation (b) Draw a scatter diagram of the data. Use the result from...
 Use the Regression tool on the accompanying wedding data, using the wedding cost as the dependent variable and attendance as the independent variable. Complete parts a through c. Click the icon to view the wedding data. a. What is the regression model? Wedding Cost =+Attendance (Round to three decimal places as needed.) b. Interpret all key regression results, hypothesis tests, and confidence intervals in the regression output from part a. Interpret the slope of the regression equation. Choose the correct...
 i Rate of Return Month Rates of return of the Rates of return of the index, x company stock, y Apr-07 4.23 3.38 May-07 3.25 5.09 Jun-07 - 1.78 0.54 -3.20 2.88 Jul-07 Aug-07 1.29 2.69 Sept-07 3.58 7.41 1.48 -4.83 Oct-07 -4.40 -2.38 Nov-07 2.37 Dec-07 -0.86 -6.12 -4.27 Jan-08 -3.48 Feb-08 -3.77 X The data in the accompanying table represent the rate of return of a certain company stock for 11 months, compared with the rate of return...
Most questions answered within 3 hours.
-
Where is the error in this code sequence?
String s1 = "Hello";
String s2 = "ello";...
asked 10 months ago -
Financial data for Joel de Paris, Inc., for last year
follow:
Joel de Paris, Inc.
Balance...
asked 10 months ago -
Consider this reaction:
Al2(SO4)3 (aq)+ BaCl3
(aq) Al2Cl6 (aq)- +
3BaSO4(s) . What is the...
asked 10 months ago -
Suppose that Savneet is considering increasing her
recent random sample from 20 car rentals to 40...
asked 10 months ago -
Trucks arrive at an unloading terminal at an average rate of 120
per hour.
Trucks arrive...
asked 10 months ago -
Why are methanol and ethanol completely soluble in water while
octanol is not very little soluble....
asked 10 months ago -
A facilities manager at a university reads in a research report
that the mean amount of...
asked 10 months ago -
When the CuSO4 is rehydrated by adding water to the anhydrous
compound, is this an endothermic...
asked 10 months ago -
A ray of sunlight is passing from diamond into crown glass; the
angle of incidence is...
asked 10 months ago -
A block of mass 0.249 kg is placed on top of a light, vertical
spring of...
asked 10 months ago -
how do the kidneys compensate in the presences of acidosis
a) trigger hyperventilate
b) reserve acid...
asked 10 months ago -
Question 501 pts
The rental rate of capital to the firm increases. Which of the
following...
asked 10 months ago