
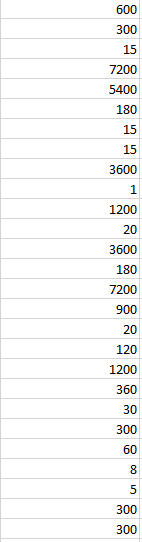

 I need to make a Range Control
Chart on excel with this data. Labeling the x axis Sample Number
and the Y axis Sample range.
I need to make a Range Control
Chart on excel with this data. Labeling the x axis Sample Number
and the Y axis Sample range.
Homework Answers
| 1 | 2 | 3 | 4 | Range |
| 300.0 | 300.0 | 0.0 | 300.0 | 300.0 |
| 3600.0 | 15.0 | 10800.0 | 270.0 | 10785.0 |
| 900.0 | 7200.0 | 1800.0 | 600.0 | 6300.0 |
| 180.0 | 5400.0 | 5.0 | 600.0 | 5395.0 |
| 240.0 | 180.0 | 2700.0 | 60.0 | 2520.0 |
| 3.0 | 15.0 | 30.0 | 180.0 | 177.0 |
| 60.0 | 15.0 | 120.0 | 120.0 | 105.0 |
| 3600.0 | 3600.0 | 60.0 | 600.0 | 3540.0 |
| 600.0 | 1.0 | 3600.0 | 3.0 | 3599.0 |
| 20.0 | 1200.0 | 10.0 | 300.0 | 1190.0 |
| 20.0 | 20.0 | 10.0 | 60.0 | 50.0 |
| 180.0 | 3600.0 | 300.0 | 600.0 | 3420.0 |
| 300.0 | 180.0 | 30.0 | 120.0 | 270.0 |
| 1200.0 | 7200.0 | 60.0 | 45.0 | 7140.0 |
| 60.0 | 900.0 | 180.0 | 240.0 | 840.0 |
| 2700.0 | 20.0 | 2700.0 | 180.0 | 2680.0 |
| 90.0 | 120.0 | 180.0 | 1800.0 | 1710.0 |
| 2700.0 | 1200.0 | 15.0 | 300.0 | 2685.0 |
| 60.0 | 360.0 | 300.0 | 120.0 | 300.0 |
| 1800.0 | 30.0 | 120.0 | 2.0 | 1770.0 |
| 30.0 | 300.0 | 300.0 | 180.0 | 270.0 |
| 14400.0 | 60.0 | 180.0 | 1800.0 | 14340.0 |
| 60.0 | 8.0 | 1200.0 | 10.0 | 1192.0 |
| 1200.0 | 5.0 | 3600.0 | 30.0 | 3595.0 |
| 180.0 | 300.0 | 30.0 | 600.0 | 570.0 |
| 120.0 | 300.0 | 45.0 | 10.0 | 255.0 |
Formula:


Formula Ref:

Choose maximum 25 for A2,D3 and D4 from table constants
Add Answer to:
I need to make a Range Control
Chart on excel with this data. Labeling the x...
I need this put in an excel spreadsheet Cost $ oeddraft.jpg Open with - The Cutting...
 I need this put in an excel spreadsheet
Cost $ oeddraft.jpg Open with - The Cutting Edge-Landscaping The Cutting Edge-Landscaping Capital Expenditures Budget Usefu Lite tem Description Salvage ONY Total Cost Depr Base Value Depr Exp in Yrs Desk 1 $600 $600 $240 $360 7 $51 Computer 1 $750 $750 $300 5 $90 Copier/printer/fax machine 1 $100 $100 $40 $60 5 $12 Customer Chairs 6 $30 $180 $72 $108 5 $22 Office Chair 1 $100 $100 $40 $60 5 $12...
I need this put in an excel spreadsheet
Cost $ oeddraft.jpg Open with - The Cutting Edge-Landscaping The Cutting Edge-Landscaping Capital Expenditures Budget Usefu Lite tem Description Salvage ONY Total Cost Depr Base Value Depr Exp in Yrs Desk 1 $600 $600 $240 $360 7 $51 Computer 1 $750 $750 $300 5 $90 Copier/printer/fax machine 1 $100 $100 $40 $60 5 $12 Customer Chairs 6 $30 $180 $72 $108 5 $22 Office Chair 1 $100 $100 $40 $60 5 $12...
6. Short-run equilibrium Consider a perfectly competitive market for wheat in Halifax. There are 120 firms...
 6. Short-run equilibrium Consider a perfectly competitive market for wheat in Halifax. There are 120 firms in the industry, each of which has the cost curves shown on the following graph: 100 90 мс о 80 60 АТС 50 40 AVC 20 10 0 5 10 15 20 25 30 35 40 45 50 OUTPUT (Thousands of bushels) COST (Cents per bushel) 70 The following graph shows the market demand for wheat. Use the orange points (square symbol) to plot...
please explain in detail number 18 and make sure i can understand ur handwriting please Figure...
 please explain in detail number 18 and make sure i can understand
ur handwriting please
Figure 9-22 The following diagram shows the domestic demand and domestic supply in a market. In addition, assume that the world price in this market is $40 per unit. tMce 190 180 Domestic Supply 170 160 150 140 130 130 110 100 90 80 70 60- 50 40 30 Domestic Demand 20 30 Qity 1000 1300 1400 1500 1800 2000 2200 2400 200 400 600...
please explain in detail number 18 and make sure i can understand
ur handwriting please
Figure 9-22 The following diagram shows the domestic demand and domestic supply in a market. In addition, assume that the world price in this market is $40 per unit. tMce 190 180 Domestic Supply 170 160 150 140 130 130 110 100 90 80 70 60- 50 40 30 Domestic Demand 20 30 Qity 1000 1300 1400 1500 1800 2000 2200 2400 200 400 600...
Hello, I am using Microsoft 365 Excel to formulate a Gantt Chart. I was doing OK until I needed to insert the "Duration" data into the chart. I have viewed numerous Youtube videos and it appea...
Hello, I am using Microsoft 365 Excel to formulate a Gantt Chart. I was doing OK until I needed to insert the "Duration" data into the chart. I have viewed numerous Youtube videos and it appears those are older versions of Excel. Can you help? Unfortunately, your service does not allow me to send all my data at once. So, I will attempt to send it piecemeal. Thanks, Dianne Morefield Shoreline Stadium Case START DATE END DATE DESCRIPTION DURATION (days)...
Please design a clipper circuit that produces voltage as shown. You may the standard value pf...
 Please design a clipper circuit that produces voltage as
shown. You may the standard value pf resistor as guidlines
ASSIGNMENT BEE2213 19201 QUESTION 2 Design a clipper circuit that produces voltage output as shown in the Figure 1. Vi 15V N ? Vi Vo Vo 5V Figure 1 @ 43% .. MY MAXIS 4G 14:38 Done Assignment_Guideline_2130afeo... 2 RSG FREE BEE2213/192011 APPENDIX 1- Standard Value Resistors Standard Values of Commercially Available Resistors Ohms (0) Kilo Ohms (KO) Mega Ohms (MO)...
Please design a clipper circuit that produces voltage as
shown. You may the standard value pf resistor as guidlines
ASSIGNMENT BEE2213 19201 QUESTION 2 Design a clipper circuit that produces voltage output as shown in the Figure 1. Vi 15V N ? Vi Vo Vo 5V Figure 1 @ 43% .. MY MAXIS 4G 14:38 Done Assignment_Guideline_2130afeo... 2 RSG FREE BEE2213/192011 APPENDIX 1- Standard Value Resistors Standard Values of Commercially Available Resistors Ohms (0) Kilo Ohms (KO) Mega Ohms (MO)...
Select two data values from your raw data – one that is inside of the confidence interval and one that is outside – one must be at the high end of the data and one at the low end – and construct two h...
Select two data values from your raw data – one that is inside of the confidence interval and one that is outside – one must be at the high end of the data and one at the low end – and construct two hypothesis tests, one for each value. One of the tests should be a “less than”, the other should be a “greater than”, depending on the value being tested. Use a 95% level of confidence, and showcase Ho...
Can somone show me how to do the 1st problem? Need to find the LS and...
 Can somone show me how to do the 1st problem? Need to
find the LS and SS for the fit and the LH and SH for the hole.
Fits are all SHAFT BASIS METRIC but the shaft and hole diameters can not be used right out of the table. This is because the 3mm shaft tolerance does not match. You will need to lookup the "Fit" from the table, and then use the LS (Largest Shaft) and SS (Smallest Shaft)...
Can somone show me how to do the 1st problem? Need to
find the LS and SS for the fit and the LH and SH for the hole.
Fits are all SHAFT BASIS METRIC but the shaft and hole diameters can not be used right out of the table. This is because the 3mm shaft tolerance does not match. You will need to lookup the "Fit" from the table, and then use the LS (Largest Shaft) and SS (Smallest Shaft)...
Build an Excel spreadsheet using the accounting equation for all the below requirement? 5 D obi...
 Build an Excel spreadsheet using the accounting equation
for all the below requirement?
5 D obi ملطصبعه جمعه 2 ring amounts summarize the financial position of Little Spotted Dog Inc. on May 31, 2020: 3 Assets Liabilities Shareholders' Equity ACCOUNTS - ACCOUNTS Tote + Computers + Supplies + Land Javanes TETEST COTTOM Cash RUtamu + . his Davobin T Double Canvas 6 Balance 3840 1920 600 15600 10320 0 5520 6120 7 8 During June 2020, the business completed these...
Build an Excel spreadsheet using the accounting equation
for all the below requirement?
5 D obi ملطصبعه جمعه 2 ring amounts summarize the financial position of Little Spotted Dog Inc. on May 31, 2020: 3 Assets Liabilities Shareholders' Equity ACCOUNTS - ACCOUNTS Tote + Computers + Supplies + Land Javanes TETEST COTTOM Cash RUtamu + . his Davobin T Double Canvas 6 Balance 3840 1920 600 15600 10320 0 5520 6120 7 8 During June 2020, the business completed these...
find v belt drive design power select belt type determine shive size (belt speed 4000 ft/min)...
 find v belt drive
design power
select belt type
determine shive size (belt speed 4000 ft/min)
find shive size from power rating figure
find rated power
find estimated centre distance
find belt length (by selecting standard belt length)
calculate actual centre distance
find contact angle for small shieve
determine correct factors
calculate correct power per belt
no. of belt needed
V-Belt Designing Sample Problem . Given: A 4 cylinder diesel engine runs at 80 hp, 1800 rpm, to drive a...
find v belt drive
design power
select belt type
determine shive size (belt speed 4000 ft/min)
find shive size from power rating figure
find rated power
find estimated centre distance
find belt length (by selecting standard belt length)
calculate actual centre distance
find contact angle for small shieve
determine correct factors
calculate correct power per belt
no. of belt needed
V-Belt Designing Sample Problem . Given: A 4 cylinder diesel engine runs at 80 hp, 1800 rpm, to drive a...
NMR IR CAN YOU PLEASE ANSWER AS SOON AS POSSIBLE THANK YOU PLEASE EXPLAIN IT IN DETAIL THANK YOU Experimental Data Only report the IR absorptions that provide diagnosis...
 NMR
IR
CAN YOU PLEASE ANSWER AS SOON AS POSSIBLE THANK
YOU
PLEASE EXPLAIN IT IN DETAIL THANK YOU
Experimental Data Only report the IR absorptions that provide diagnosis for the major functional groups. Copies of your spectra will be included in your lab report with this information written on the spectra. However, the information should also be included in the body of the report in a text format similar to the example given below IR cm1: 1735 (C-o); MS:...
NMR
IR
CAN YOU PLEASE ANSWER AS SOON AS POSSIBLE THANK
YOU
PLEASE EXPLAIN IT IN DETAIL THANK YOU
Experimental Data Only report the IR absorptions that provide diagnosis for the major functional groups. Copies of your spectra will be included in your lab report with this information written on the spectra. However, the information should also be included in the body of the report in a text format similar to the example given below IR cm1: 1735 (C-o); MS:...
 I need this put in an excel spreadsheet
Cost $ oeddraft.jpg Open with - The Cutting Edge-Landscaping The Cutting Edge-Landscaping Capital Expenditures Budget Usefu Lite tem Description Salvage ONY Total Cost Depr Base Value Depr Exp in Yrs Desk 1 $600 $600 $240 $360 7 $51 Computer 1 $750 $750 $300 5 $90 Copier/printer/fax machine 1 $100 $100 $40 $60 5 $12 Customer Chairs 6 $30 $180 $72 $108 5 $22 Office Chair 1 $100 $100 $40 $60 5 $12...
I need this put in an excel spreadsheet
Cost $ oeddraft.jpg Open with - The Cutting Edge-Landscaping The Cutting Edge-Landscaping Capital Expenditures Budget Usefu Lite tem Description Salvage ONY Total Cost Depr Base Value Depr Exp in Yrs Desk 1 $600 $600 $240 $360 7 $51 Computer 1 $750 $750 $300 5 $90 Copier/printer/fax machine 1 $100 $100 $40 $60 5 $12 Customer Chairs 6 $30 $180 $72 $108 5 $22 Office Chair 1 $100 $100 $40 $60 5 $12...
 6. Short-run equilibrium Consider a perfectly competitive market for wheat in Halifax. There are 120 firms in the industry, each of which has the cost curves shown on the following graph: 100 90 мс о 80 60 АТС 50 40 AVC 20 10 0 5 10 15 20 25 30 35 40 45 50 OUTPUT (Thousands of bushels) COST (Cents per bushel) 70 The following graph shows the market demand for wheat. Use the orange points (square symbol) to plot...
 please explain in detail number 18 and make sure i can understand
ur handwriting please
Figure 9-22 The following diagram shows the domestic demand and domestic supply in a market. In addition, assume that the world price in this market is $40 per unit. tMce 190 180 Domestic Supply 170 160 150 140 130 130 110 100 90 80 70 60- 50 40 30 Domestic Demand 20 30 Qity 1000 1300 1400 1500 1800 2000 2200 2400 200 400 600...
please explain in detail number 18 and make sure i can understand
ur handwriting please
Figure 9-22 The following diagram shows the domestic demand and domestic supply in a market. In addition, assume that the world price in this market is $40 per unit. tMce 190 180 Domestic Supply 170 160 150 140 130 130 110 100 90 80 70 60- 50 40 30 Domestic Demand 20 30 Qity 1000 1300 1400 1500 1800 2000 2200 2400 200 400 600...
 Please design a clipper circuit that produces voltage as
shown. You may the standard value pf resistor as guidlines
ASSIGNMENT BEE2213 19201 QUESTION 2 Design a clipper circuit that produces voltage output as shown in the Figure 1. Vi 15V N ? Vi Vo Vo 5V Figure 1 @ 43% .. MY MAXIS 4G 14:38 Done Assignment_Guideline_2130afeo... 2 RSG FREE BEE2213/192011 APPENDIX 1- Standard Value Resistors Standard Values of Commercially Available Resistors Ohms (0) Kilo Ohms (KO) Mega Ohms (MO)...
Please design a clipper circuit that produces voltage as
shown. You may the standard value pf resistor as guidlines
ASSIGNMENT BEE2213 19201 QUESTION 2 Design a clipper circuit that produces voltage output as shown in the Figure 1. Vi 15V N ? Vi Vo Vo 5V Figure 1 @ 43% .. MY MAXIS 4G 14:38 Done Assignment_Guideline_2130afeo... 2 RSG FREE BEE2213/192011 APPENDIX 1- Standard Value Resistors Standard Values of Commercially Available Resistors Ohms (0) Kilo Ohms (KO) Mega Ohms (MO)...
 Can somone show me how to do the 1st problem? Need to
find the LS and SS for the fit and the LH and SH for the hole.
Fits are all SHAFT BASIS METRIC but the shaft and hole diameters can not be used right out of the table. This is because the 3mm shaft tolerance does not match. You will need to lookup the "Fit" from the table, and then use the LS (Largest Shaft) and SS (Smallest Shaft)...
Can somone show me how to do the 1st problem? Need to
find the LS and SS for the fit and the LH and SH for the hole.
Fits are all SHAFT BASIS METRIC but the shaft and hole diameters can not be used right out of the table. This is because the 3mm shaft tolerance does not match. You will need to lookup the "Fit" from the table, and then use the LS (Largest Shaft) and SS (Smallest Shaft)...
 Build an Excel spreadsheet using the accounting equation
for all the below requirement?
5 D obi ملطصبعه جمعه 2 ring amounts summarize the financial position of Little Spotted Dog Inc. on May 31, 2020: 3 Assets Liabilities Shareholders' Equity ACCOUNTS - ACCOUNTS Tote + Computers + Supplies + Land Javanes TETEST COTTOM Cash RUtamu + . his Davobin T Double Canvas 6 Balance 3840 1920 600 15600 10320 0 5520 6120 7 8 During June 2020, the business completed these...
Build an Excel spreadsheet using the accounting equation
for all the below requirement?
5 D obi ملطصبعه جمعه 2 ring amounts summarize the financial position of Little Spotted Dog Inc. on May 31, 2020: 3 Assets Liabilities Shareholders' Equity ACCOUNTS - ACCOUNTS Tote + Computers + Supplies + Land Javanes TETEST COTTOM Cash RUtamu + . his Davobin T Double Canvas 6 Balance 3840 1920 600 15600 10320 0 5520 6120 7 8 During June 2020, the business completed these...
 find v belt drive
design power
select belt type
determine shive size (belt speed 4000 ft/min)
find shive size from power rating figure
find rated power
find estimated centre distance
find belt length (by selecting standard belt length)
calculate actual centre distance
find contact angle for small shieve
determine correct factors
calculate correct power per belt
no. of belt needed
V-Belt Designing Sample Problem . Given: A 4 cylinder diesel engine runs at 80 hp, 1800 rpm, to drive a...
find v belt drive
design power
select belt type
determine shive size (belt speed 4000 ft/min)
find shive size from power rating figure
find rated power
find estimated centre distance
find belt length (by selecting standard belt length)
calculate actual centre distance
find contact angle for small shieve
determine correct factors
calculate correct power per belt
no. of belt needed
V-Belt Designing Sample Problem . Given: A 4 cylinder diesel engine runs at 80 hp, 1800 rpm, to drive a...
 NMR
IR
CAN YOU PLEASE ANSWER AS SOON AS POSSIBLE THANK
YOU
PLEASE EXPLAIN IT IN DETAIL THANK YOU
Experimental Data Only report the IR absorptions that provide diagnosis for the major functional groups. Copies of your spectra will be included in your lab report with this information written on the spectra. However, the information should also be included in the body of the report in a text format similar to the example given below IR cm1: 1735 (C-o); MS:...
NMR
IR
CAN YOU PLEASE ANSWER AS SOON AS POSSIBLE THANK
YOU
PLEASE EXPLAIN IT IN DETAIL THANK YOU
Experimental Data Only report the IR absorptions that provide diagnosis for the major functional groups. Copies of your spectra will be included in your lab report with this information written on the spectra. However, the information should also be included in the body of the report in a text format similar to the example given below IR cm1: 1735 (C-o); MS:...
Most questions answered within 3 hours.
-
Where is the error in this code sequence?
String s1 = "Hello";
String s2 = "ello";...
asked 10 months ago -
Financial data for Joel de Paris, Inc., for last year
follow:
Joel de Paris, Inc.
Balance...
asked 10 months ago -
Consider this reaction:
Al2(SO4)3 (aq)+ BaCl3
(aq) Al2Cl6 (aq)- +
3BaSO4(s) . What is the...
asked 10 months ago -
Suppose that Savneet is considering increasing her
recent random sample from 20 car rentals to 40...
asked 10 months ago -
Trucks arrive at an unloading terminal at an average rate of 120
per hour.
Trucks arrive...
asked 10 months ago -
Why are methanol and ethanol completely soluble in water while
octanol is not very little soluble....
asked 10 months ago -
A facilities manager at a university reads in a research report
that the mean amount of...
asked 10 months ago -
When the CuSO4 is rehydrated by adding water to the anhydrous
compound, is this an endothermic...
asked 10 months ago -
A ray of sunlight is passing from diamond into crown glass; the
angle of incidence is...
asked 10 months ago -
A block of mass 0.249 kg is placed on top of a light, vertical
spring of...
asked 10 months ago -
how do the kidneys compensate in the presences of acidosis
a) trigger hyperventilate
b) reserve acid...
asked 10 months ago -
Question 501 pts
The rental rate of capital to the firm increases. Which of the
following...
asked 10 months ago