Project question 1 Using the data in the file named Chapter 11 Data Set 2, test...
Project question 1
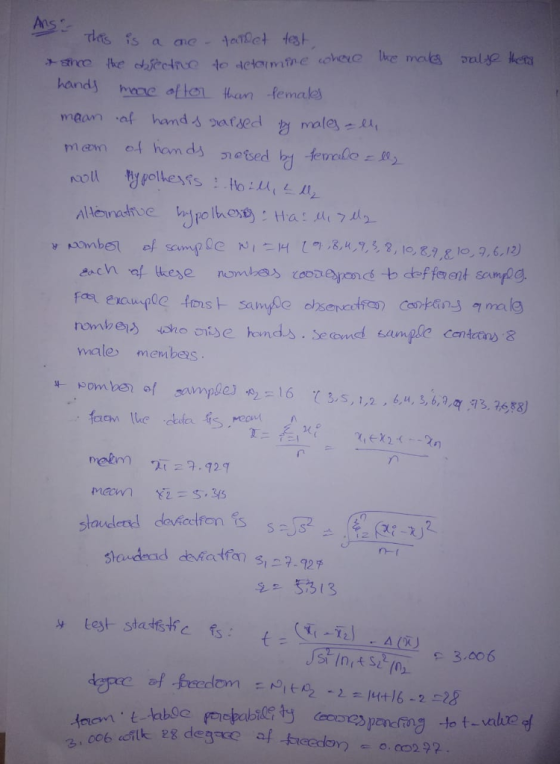
Using the data in the file named Chapter 11 Data Set 2, test the research hypothesis at the .05 level of significance that males raise their hands in class more often than females. Do this practice problem by hand using a calculator. What is your conclusion regarding the research hypothesis? Remember to first decide whether this is a one- or two tailed test.
|
Males |
Females |
|
9 |
3 |
|
8 |
5 |
|
4 |
1 |
|
9 |
2 |
|
3 |
6 |
|
8 |
4 |
|
10 |
3 |
|
8 |
6 |
|
9 |
7 |
|
8 |
9 |
|
10 |
7 |
|
7 |
3 |
|
6 |
7 |
|
12 |
6 |
|
8 |
|
|
8 |
Homework Answers

Add Answer to:
Project question 1
Using the data in the file named Chapter 11 Data Set 2, test...
Question A. The below data correspond to an independent-measures t test. 1. Provide a hypothetical research...
 Question A. The below data correspond to an independent-measures t test. 1. Provide a hypothetical research question that is appropriate for an independent- measures t test. 2. Identify the independent and dependent variables of your research design, including the levels of the independent variable. 3. Describe what an alpha level is, and what the alpha level's relationship is to the null hypothesis in the specific context of your research study. 4. Using the following data below, determine whether the data...
ANOVA Homework 1. How is an ANOVA different from a t-test? 2. When and why do...
 ANOVA Homework 1. How is an ANOVA different from a t-test? 2. When and why do you use a post-hoc test? Indicate when you use a Fisher's test vs. a Tukey's HSD. 3. A researcher was interested in examining the decision making processes of people who work different shifts in a factory. They ask the participants from each shift to answer a set of questions regarding how they would deal with potential issues in the factory. Below are the scores...
Using the data in the file named “Dataset 1,” to determine is there was a change...
Using the data in the file named “Dataset 1,” to determine is there was a change in the number of tons of paper used after the implementation of a recycling program in 25 different districts. a. Is this study using dependent or independent samples? b. What is your research hypothesis? c. Using Excel, calculate your test statistic and p-value. Paste the output here. d. What do you conclude? Below is the data set that is mentioned above Before Recycling 20...
Using the following data set, conduct an independent samples t-test. Use a= 0.05 and a two-tailed...
Using the following data set, conduct an independent samples t-test. Use a= 0.05 and a two-tailed test. Sample 1: 14, 14, 13, 13, 10, 12, 14, 15, 17 Sample 2: 15, 11, 15, 13, 14, 13, 14, 14, 15 1. hypotheses: null and alternative 2. t-critical value; shade of regions of rejection 3. t-obtain 4. conclusion 5. decide if significant 6. compute for confidence interval is significant
Data Conduct an independent samples t-test (a.k.a., between-subjects design). Each sample should have at least n...
 Data
Conduct an independent samples t-test (a.k.a., between-subjects design). Each sample should have at least n=8 individuals. What to turn in: 1. What is your research question? 2. State the null (Ho) and alternative (H1) hypotheses. 3. Conduct the hypothesis test using an alpha level of .05, and state your conclusion (Reject Ho/Fail to Reject Ho) regarding the original hypotheses. 4. Calculate and interpret a measure of effect size (est. Cohen's d or r2) and a 95% confidence interval. Subject...
Data
Conduct an independent samples t-test (a.k.a., between-subjects design). Each sample should have at least n=8 individuals. What to turn in: 1. What is your research question? 2. State the null (Ho) and alternative (H1) hypotheses. 3. Conduct the hypothesis test using an alpha level of .05, and state your conclusion (Reject Ho/Fail to Reject Ho) regarding the original hypotheses. 4. Calculate and interpret a measure of effect size (est. Cohen's d or r2) and a 95% confidence interval. Subject...
In a study on attraction, suppose subjects were asked to rate pictures of females and males...
In a study on attraction, suppose subjects were asked to rate pictures of females and males taken before and after a face-lift. Subjects rated the pictures on a number of variables. The total attractiveness ratings are given below, with higher numbers meaning higher attractiveness. You are asked to test whether face-lifts improve the looks of the subjects. Subject: 1 2 3 4 5 6 7 8 9 10 11 12 13 14 15 Before: 22 24 26 20 23 22...
Statistics for people who (think they) hate statistics 4th Edition Using the data in Chapter 15...
Statistics for people who (think they) hate statistics 4th Edition Using the data in Chapter 15 Data Set 1 to answer the questions below. Do the analysis manually or using the Data Analysis tools in excel. a. Compute the correlation between motivation and GPA. b. Test for the significance of the correlation coefficient at the .05 level using a two-tailed test. c. The more highly you are motivated, the more you will study- true or false? which did you select...
The following data are from an experiment designed to investigate the perception of corporate eth...
The following data are from an experiment designed to investigate the perception of corporate ethical values among individuals who are in marketing. Three groups are considered: management, research and advertising (higher scores indicate higher ethical values). Marketing Managers 8 7 6 7 8 6 Marketing Research 10 10 9 9 10 9 Advertising 5 6 5 4 5 5 Compute the values identified below (to 1 decimal, if necessary). Sum of Squares, Treatment? Sum of Squares, Error? Mean Squares, Treatment?...
please explain throughly It doesn’t need sample data. That’s how the question was intended to be. Il. A friends someone has. A tailed test friends so was done to test whether the amount of narcis...
 please explain throughly
It
doesn’t need sample data. That’s how the question was intended to
be.
Il. A friends someone has. A tailed test friends so was done to test whether the amount of narcissism is a good predictor of number of sample of 10 participants was used. Assume an alpha level of.05 and a two- of 9. What statistical test should you use to evaluate the hypothesis above? 10. What are the null and alternative hypotheses in words? Null...
please explain throughly
It
doesn’t need sample data. That’s how the question was intended to
be.
Il. A friends someone has. A tailed test friends so was done to test whether the amount of narcissism is a good predictor of number of sample of 10 participants was used. Assume an alpha level of.05 and a two- of 9. What statistical test should you use to evaluate the hypothesis above? 10. What are the null and alternative hypotheses in words? Null...
1. What are null hypothesis and alternative hypothesis? 2. Inastatisticaltest,wehavethechoiceofatwo-tailedtest,aleft- tailed test, or a right-tailed test. Which hypothesis is the determining factor fo...
1. What are null hypothesis and alternative hypothesis? 2. Inastatisticaltest,wehavethechoiceofatwo-tailedtest,aleft- tailed test, or a right-tailed test. Which hypothesis is the determining factor for choosing the direction of the test? (In other words, how would you decide it) 3. Forthesamesampledataandnullhypothesis,howdoesthe P-value for a two-tailed test compare to that for a one-tailed test? 4. Using P-value method, how would you reject or fail to reject the null hypothesis? (what is the decision criteria?) How does level of significance matter to the hypothesis...
 Question A. The below data correspond to an independent-measures t test. 1. Provide a hypothetical research question that is appropriate for an independent- measures t test. 2. Identify the independent and dependent variables of your research design, including the levels of the independent variable. 3. Describe what an alpha level is, and what the alpha level's relationship is to the null hypothesis in the specific context of your research study. 4. Using the following data below, determine whether the data...
 ANOVA Homework 1. How is an ANOVA different from a t-test? 2. When and why do you use a post-hoc test? Indicate when you use a Fisher's test vs. a Tukey's HSD. 3. A researcher was interested in examining the decision making processes of people who work different shifts in a factory. They ask the participants from each shift to answer a set of questions regarding how they would deal with potential issues in the factory. Below are the scores...
 Data
Conduct an independent samples t-test (a.k.a., between-subjects design). Each sample should have at least n=8 individuals. What to turn in: 1. What is your research question? 2. State the null (Ho) and alternative (H1) hypotheses. 3. Conduct the hypothesis test using an alpha level of .05, and state your conclusion (Reject Ho/Fail to Reject Ho) regarding the original hypotheses. 4. Calculate and interpret a measure of effect size (est. Cohen's d or r2) and a 95% confidence interval. Subject...
Data
Conduct an independent samples t-test (a.k.a., between-subjects design). Each sample should have at least n=8 individuals. What to turn in: 1. What is your research question? 2. State the null (Ho) and alternative (H1) hypotheses. 3. Conduct the hypothesis test using an alpha level of .05, and state your conclusion (Reject Ho/Fail to Reject Ho) regarding the original hypotheses. 4. Calculate and interpret a measure of effect size (est. Cohen's d or r2) and a 95% confidence interval. Subject...
 please explain throughly
It
doesn’t need sample data. That’s how the question was intended to
be.
Il. A friends someone has. A tailed test friends so was done to test whether the amount of narcissism is a good predictor of number of sample of 10 participants was used. Assume an alpha level of.05 and a two- of 9. What statistical test should you use to evaluate the hypothesis above? 10. What are the null and alternative hypotheses in words? Null...
please explain throughly
It
doesn’t need sample data. That’s how the question was intended to
be.
Il. A friends someone has. A tailed test friends so was done to test whether the amount of narcissism is a good predictor of number of sample of 10 participants was used. Assume an alpha level of.05 and a two- of 9. What statistical test should you use to evaluate the hypothesis above? 10. What are the null and alternative hypotheses in words? Null...
Most questions answered within 3 hours.
-
Where is the error in this code sequence?
String s1 = "Hello";
String s2 = "ello";...
asked 10 months ago -
Financial data for Joel de Paris, Inc., for last year
follow:
Joel de Paris, Inc.
Balance...
asked 10 months ago -
Consider this reaction:
Al2(SO4)3 (aq)+ BaCl3
(aq) Al2Cl6 (aq)- +
3BaSO4(s) . What is the...
asked 10 months ago -
Suppose that Savneet is considering increasing her
recent random sample from 20 car rentals to 40...
asked 10 months ago -
Trucks arrive at an unloading terminal at an average rate of 120
per hour.
Trucks arrive...
asked 10 months ago -
Why are methanol and ethanol completely soluble in water while
octanol is not very little soluble....
asked 10 months ago -
A facilities manager at a university reads in a research report
that the mean amount of...
asked 10 months ago -
When the CuSO4 is rehydrated by adding water to the anhydrous
compound, is this an endothermic...
asked 10 months ago -
A ray of sunlight is passing from diamond into crown glass; the
angle of incidence is...
asked 10 months ago -
A block of mass 0.249 kg is placed on top of a light, vertical
spring of...
asked 10 months ago -
how do the kidneys compensate in the presences of acidosis
a) trigger hyperventilate
b) reserve acid...
asked 10 months ago -
Question 501 pts
The rental rate of capital to the firm increases. Which of the
following...
asked 10 months ago