Rainbow Appliance Company has been in business for 10 years manufacturing and selling various household appliances. Four years ago Rainbow had an R&D breakthrough when the developed a new vacuum cleaner and sales for this product took off! The fiscal year of 2018 and 2019 have experienced the most growth. The company currently holds appox. 25% of the household vacuum market in the U.S.
You have been assigned to the 2019 audit of Rainbow. In 2017, Rainbow executive accomplished a leveraged stock buyout and Rainbow has experienced earners per share growth since, with the unaudited 2019 financial statements reflected an earnings per share of $1.21 (up from the 2017 amount of $0.46), which is more than analysts had projected. Sales and net income have also experienced impressive increases over the same period of time.
It's time to start the risk assessment analytical procedures for
audit the 2019 financial statements and start planning the nature,
timing, and extent of the needed audit procedures. You will begin
by identifying areas that may represent the most risk relevant to
this year's audit. 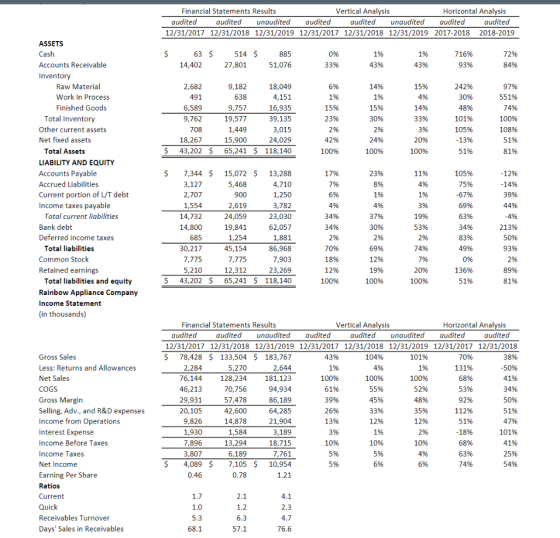
Homework Answers
SOLUTION
areas that may represent the most risk relevant to this year's audit are as follows
Current Assets
The quick ratio is a measure of how well a
company can meet its short-term financial liabilities. Also known
as the acid-test ratio, it can be calculated as follows:
(Cash + Marketable Securities + Accounts Receivable) /
Current Liabilities
A common rule of thumb is that companies with a quick ratio of greater than 1.0 are sufficiently able to meet their short-term liabilities.
The current ratio is a liquidity ratio that measures a company's ability to pay short-term obligations or those due within one year.
A common rule of thumb is that companies with a current ratio of greater than 2:1 are sufficiently able to meet their short-term liabilities.
In the present case, the quick ration is increasing year on year and in the current year it is 2.3 , where as current ratio inreased to 4.1
It should be checked why both quick and current ratios have increased.
Days sales outstanding (DSO) is a measure of the average number of days that it takes a company to collect payment after a sale has been made. DSO is often determined on a monthly, quarterly or annual basis, and can be calculated by dividing the amount of accounts receivable during a given period by the total value of credit sales during the same period, and multiplying the result by the number of days in the period measured.
Days sales outstanding is an element of the cash conversion cycle and is often referred to as days receivables or average collection period.
receivables turnover ratio is decreasing and DSO has increased. The reason should be checked and reported.
Add Answer to:
Rainbow Appliance Company has been in business for 10 years
manufacturing and selling various household appliances....
Selected comparative financial statements of Korbin Company follow. KORBIN COMPANY Comparative Income Statements For Years Ended...
 Selected comparative financial statements of Korbin Company follow. KORBIN COMPANY Comparative Income Statements For Years Ended December 31, 2019, 2018, and 2017 2019 2018 2017 Sales $ 524,799 $ 402,039 $ 279,000 Cost of goods sold 315,929 251,676 178,560 Gross profit 208,870 150,363 100, 440 Selling expenses 74,521 55,481 36,828 Administrative expenses 47,232 35, 379 23, 157 Total expenses 121,753 90,860 59,985 Income before taxes 87,117 59,583 40, 455 Income tax expense 16, 204 12,198 8,212 Net income $ 79,913...
Selected comparative financial statements of Korbin Company follow. KORBIN COMPANY Comparative Income Statements For Years Ended...
 Selected comparative financial statements of Korbin Company follow. KORBIN COMPANY Comparative Income Statements For Years Ended December 31, 2019, 2018, and 2017 2019 2018 2017 Sales $ 386,922 $296,414 $ 205,700 Cost of goods sold 232,927 185,259 131,648 Gross profit 153,995 111,155 74,052 Selling expenses 54,943 40,905 27,152 Administrative expenses 34,823 26,084 17,073 Total expenses 89,766 66,989 44, 225 Income before taxes 64,129 44,166 29,827 Income tax expense 11,947 9,054 6,055 Net income $ 52,282 $ 35,112 $ 23,772 2017...
Selected comparative financial statements of Korbin Company follow. KORBIN COMPANY Comparative Income Statements For Years Ended...
Selected comparative financial statements of Korbin Company follow. KORBIN COMPANY Comparative Income Statements For Years Ended December 31, 2019, 2018, and 2017 2019 2018 2017 Sales $ 555,000 $ 340,000 $ 278,000 Cost of goods sold 283,500 212,500 153,900 Gross profit 271,500 127,500 124,100 Selling expenses 102,900 46,920 50,800 Administrative expenses 50,668 29,920 22,800 Total expenses 153,568 76,840 73,600 Income before taxes 117,932 50,660 50,500 Income tax expense 40,800 10,370 15,670 Net income $ 77,132 $ 40,290 $ 34,830 KORBIN...
Selected comparative financial statements of Korbin Company follow. KORBIN COMPANY Comparative Income Statements For Years Ended...
 Selected comparative financial statements of Korbin Company follow. KORBIN COMPANY Comparative Income Statements For Years Ended December 31, 2019, 2018, and 2017 2019 2018 2017 Sales $ 524,799 $ 402,039 $ 279,000 Cost of goods sold 315,929 251,676 178,560 Gross profit 208,870 150,363 100,440 Selling expenses 74,521 55,481 36,828 Administrative expenses 47,232 35, 379 23,157 Total expenses 121,753 90,860 59,985 Income before taxes 87,117 59,503 40, 455 Income tax expense 16, 204 12,198 8,212 Net income $ 70,913 $ 47,305...
Selected comparative financial statements of Korbin Company follow. KORBIN COMPANY Comparative Income Statements For Years Ended...
 Selected comparative financial statements of Korbin Company follow. KORBIN COMPANY Comparative Income Statements For Years Ended December 31, 2019, 2018, and 2017 2019 2018 2017 Sales $ 427,928 $ 327,828 $ 227,500 Cost of goods sold 257,613 207,515 145,600 Gross profit 170,315 120,313 81,900 Selling expenses 60,766 45, 240 30,030 Administrative expenses 38,514 28,849 18,883 Total expenses 99, 280 74,089 48,913 Income before taxes 71,035 46,224 32,987 Income tax expense 13,213 9,476 6,696 Net income $ 57,822 $ 36,748 $...
Selected comparative financial statements of Korbin Company follow. KORBIN COMPANY Comparative Income Statements For Years Ended...
 Selected comparative financial statements of Korbin Company follow. KORBIN COMPANY Comparative Income Statements For Years Ended December 31, 2019, 2018, and. 2017 2019 2018 2017 $434,323 $332,727 $230,900 Sales Cost of goods sold 261,462 Gross profit Selling expenses Administrative 209,951 122,776 147,776 83,124 172,861 61,674 45,916 30,479 39,089 29,280 19,165 expenses Total expenses Income before 100,763 75,196 49,644 72,098 47,580 33,480 taxes Income tax expense 13,410 9,754 6,796 $58,688 $ 37,826 26,684 Net income KORBIN COMPANY Comparative Balance Sheets December...
Selected comparative financial statements of Korbin Company follow. KORBIN COMPANY Comparative Income Statements For Years Ended...
 Selected comparative financial statements of Korbin Company follow. KORBIN COMPANY Comparative Income Statements For Years Ended December 31, 2019, 2018, and 2017 2019 2018 2017 Sales $ 471,191 $360, 971 $ 250, 500 Cost of goods sold 283, 657 226, 329 160, 320 Gross profit 187,534 134, 642 90, 180 Selling expenses 66,909 49,814 33,066 Administrative expenses 42, 407 31,765 20,792 Total expenses 109, 316 81,579 53, 858 Income before taxes 78, 218 53,063 36, 322 Income tax expense 14,549...
Assume the financial statements of ABC Corporation for years 2017, 2018 and 2019: Statement of financial...
Assume the financial statements of ABC Corporation for years 2017, 2018 and 2019: Statement of financial position (balance sheet) as of 31/12/2017 31/12/2018 31/12/2019 Fixed assets (net value) 100,000 180,000 175,000 Inventory 80,000 88,500 90,000 Accounts receivable 70,000 92,000 86,000 Other assets 35,000 90,000 207,000 Cash 90,000 130,000 142,000 Total assets 375,000 580,500 700,000 Share capital 150,000 150,000 150,000 Retained earnings 160,000 366,400 464,080 Accounts payable 65,000 64,100 85,920 Total equity and liabilities 375,000 580,500 700,000 Income statements for years...
Selected comparative financial statements of Korbin Company follow. KORBIN COMPANY Comparative Income Statements For Years Ended...
Selected comparative financial statements of Korbin Company follow. KORBIN COMPANY Comparative Income Statements For Years Ended December 31, 2019, 2018, and 2017 2019 2018 2017 Sales $ 479,843 $ 367,599 $ 255,100 Cost of goods sold 288,865 230,117 163,264 Gross profit 190,978 137,482 91,836 Selling expenses 68,138 50,729 33,673 Administrative expenses 43,186 32,349 21,173 Total expenses 111,324 83,078 54,846 Income before taxes 79,654 54,404 36,990 Income tax expense 14,816 11,153 7,509 Net income $ 64,838 $ 43,251 $ 29,481 KORBIN...
Selected comparative financial statements of Korbin Company follow. KORBIN COMPANY Comparative Income Statements For Years Ended...
 Selected comparative financial statements of Korbin Company follow. KORBIN COMPANY Comparative Income Statements For Years Ended December 31, 2019, 2018, and 2017 2019 2018 2017 Sales $ 471,191 $360, 971 $ 250, 500 Cost of goods sold 283, 657 226, 329 160, 320 Gross profit 187,534 134, 642 90, 180 Selling expenses 66,909 49,814 33,066 Administrative expenses 42, 407 31,765 20,792 Total expenses 109, 316 81,579 53, 858 Income before taxes 78, 218 53,063 36, 322 Income tax expense 14,549...
 Selected comparative financial statements of Korbin Company follow. KORBIN COMPANY Comparative Income Statements For Years Ended December 31, 2019, 2018, and 2017 2019 2018 2017 Sales $ 524,799 $ 402,039 $ 279,000 Cost of goods sold 315,929 251,676 178,560 Gross profit 208,870 150,363 100, 440 Selling expenses 74,521 55,481 36,828 Administrative expenses 47,232 35, 379 23, 157 Total expenses 121,753 90,860 59,985 Income before taxes 87,117 59,583 40, 455 Income tax expense 16, 204 12,198 8,212 Net income $ 79,913...
 Selected comparative financial statements of Korbin Company follow. KORBIN COMPANY Comparative Income Statements For Years Ended December 31, 2019, 2018, and 2017 2019 2018 2017 Sales $ 386,922 $296,414 $ 205,700 Cost of goods sold 232,927 185,259 131,648 Gross profit 153,995 111,155 74,052 Selling expenses 54,943 40,905 27,152 Administrative expenses 34,823 26,084 17,073 Total expenses 89,766 66,989 44, 225 Income before taxes 64,129 44,166 29,827 Income tax expense 11,947 9,054 6,055 Net income $ 52,282 $ 35,112 $ 23,772 2017...
 Selected comparative financial statements of Korbin Company follow. KORBIN COMPANY Comparative Income Statements For Years Ended December 31, 2019, 2018, and 2017 2019 2018 2017 Sales $ 524,799 $ 402,039 $ 279,000 Cost of goods sold 315,929 251,676 178,560 Gross profit 208,870 150,363 100,440 Selling expenses 74,521 55,481 36,828 Administrative expenses 47,232 35, 379 23,157 Total expenses 121,753 90,860 59,985 Income before taxes 87,117 59,503 40, 455 Income tax expense 16, 204 12,198 8,212 Net income $ 70,913 $ 47,305...
 Selected comparative financial statements of Korbin Company follow. KORBIN COMPANY Comparative Income Statements For Years Ended December 31, 2019, 2018, and 2017 2019 2018 2017 Sales $ 427,928 $ 327,828 $ 227,500 Cost of goods sold 257,613 207,515 145,600 Gross profit 170,315 120,313 81,900 Selling expenses 60,766 45, 240 30,030 Administrative expenses 38,514 28,849 18,883 Total expenses 99, 280 74,089 48,913 Income before taxes 71,035 46,224 32,987 Income tax expense 13,213 9,476 6,696 Net income $ 57,822 $ 36,748 $...
 Selected comparative financial statements of Korbin Company follow. KORBIN COMPANY Comparative Income Statements For Years Ended December 31, 2019, 2018, and. 2017 2019 2018 2017 $434,323 $332,727 $230,900 Sales Cost of goods sold 261,462 Gross profit Selling expenses Administrative 209,951 122,776 147,776 83,124 172,861 61,674 45,916 30,479 39,089 29,280 19,165 expenses Total expenses Income before 100,763 75,196 49,644 72,098 47,580 33,480 taxes Income tax expense 13,410 9,754 6,796 $58,688 $ 37,826 26,684 Net income KORBIN COMPANY Comparative Balance Sheets December...
 Selected comparative financial statements of Korbin Company follow. KORBIN COMPANY Comparative Income Statements For Years Ended December 31, 2019, 2018, and 2017 2019 2018 2017 Sales $ 471,191 $360, 971 $ 250, 500 Cost of goods sold 283, 657 226, 329 160, 320 Gross profit 187,534 134, 642 90, 180 Selling expenses 66,909 49,814 33,066 Administrative expenses 42, 407 31,765 20,792 Total expenses 109, 316 81,579 53, 858 Income before taxes 78, 218 53,063 36, 322 Income tax expense 14,549...
 Selected comparative financial statements of Korbin Company follow. KORBIN COMPANY Comparative Income Statements For Years Ended December 31, 2019, 2018, and 2017 2019 2018 2017 Sales $ 471,191 $360, 971 $ 250, 500 Cost of goods sold 283, 657 226, 329 160, 320 Gross profit 187,534 134, 642 90, 180 Selling expenses 66,909 49,814 33,066 Administrative expenses 42, 407 31,765 20,792 Total expenses 109, 316 81,579 53, 858 Income before taxes 78, 218 53,063 36, 322 Income tax expense 14,549...
Most questions answered within 3 hours.
-
Where is the error in this code sequence?
String s1 = "Hello";
String s2 = "ello";...
asked 11 months ago -
Financial data for Joel de Paris, Inc., for last year
follow:
Joel de Paris, Inc.
Balance...
asked 11 months ago -
Consider this reaction:
Al2(SO4)3 (aq)+ BaCl3
(aq) Al2Cl6 (aq)- +
3BaSO4(s) . What is the...
asked 11 months ago -
Suppose that Savneet is considering increasing her
recent random sample from 20 car rentals to 40...
asked 11 months ago -
Trucks arrive at an unloading terminal at an average rate of 120
per hour.
Trucks arrive...
asked 11 months ago -
Why are methanol and ethanol completely soluble in water while
octanol is not very little soluble....
asked 11 months ago -
A facilities manager at a university reads in a research report
that the mean amount of...
asked 11 months ago -
When the CuSO4 is rehydrated by adding water to the anhydrous
compound, is this an endothermic...
asked 11 months ago -
A ray of sunlight is passing from diamond into crown glass; the
angle of incidence is...
asked 11 months ago -
A block of mass 0.249 kg is placed on top of a light, vertical
spring of...
asked 11 months ago -
how do the kidneys compensate in the presences of acidosis
a) trigger hyperventilate
b) reserve acid...
asked 11 months ago -
Question 501 pts
The rental rate of capital to the firm increases. Which of the
following...
asked 11 months ago