As consultants in advisory services at an accounting firm, we are hired by management of Gadberry to advise on cash flow reporting. Management is concerned about the relatively small net increase in cash, and how the company is doing compared to competitors Nessly and Tootsey. The following Tableau Dashboard will assist in our analysis.


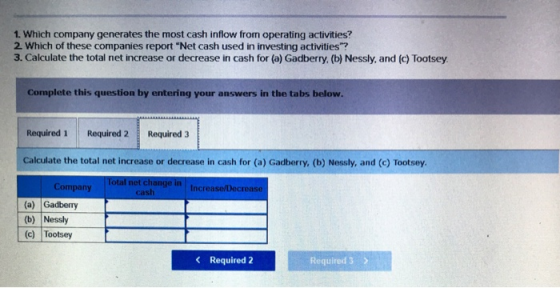
1. Which company generates the most cash inflow from operating activities? 2. Which of these companies report "Net cash used in investing activities? 3. Calculate the total net increase or decrease in cash for (a) Gadberry. (b) Nessly, and (c) Tootsey.
Homework Answers
Part 1
|
Which company generates the most cash inflow from operating activities? |
Gadberry |
Gadberry = $40000
Nessly = $(30000)
Tootsey = $10000
Part 2
|
Which of these companies report "Net cash used in investing activities"? |
Gadberry Tootsey |
Net cash used in investing activities refers to cash outflow from operating activities
Part 3
|
Company |
Total net change in cash |
Increase/decrease |
|
|
(a) |
Gadberry |
$2000 |
Increase |
|
(b) |
Nessly |
$10000 |
Increase |
|
(c) |
Tootsey |
$47000 |
Increase |
Total net change in cash = cash flow from operating activities + cash flow from investing activities and cash flow from financing activities
Gadberry = 40000-4000-34000 = $2000
Nessly = -30000+15000+25000 = $10000
Tootsey = 10000-9000+46000 = $47000
As all numbers are positive it indicates there is increase in cash balance
Add Answer to:
As consultants in advisory services at an accounting firm, we are hired by management of Gadberry...
As consultants in advisory services at an accounting firm, weare hired by management of Gadberry...
 As consultants in advisory services at an accounting firm, we
are hired by management of Gadberry to advise on cash flow
reporting. Management is concerned about the relatively small net
increase in cash, and how the company is doing compared to
competitors Nessly and Tootsey. The following Tableau Dashboard
will assist in our analysis.Gadberry (green) Operating Activities:
$40,000Nessly (Red) Investing Activites: $15,000Nessly (Orange) Financing: $25,000Tootsey (Green) Operating Activities:
$10,000Gadberry (Red) Investing Activities:
$(4,000)Gadberry (Orange) Financing Activities:
$(34,000)Nessly (Green) Operating Activites:...
As consultants in advisory services at an accounting firm, we
are hired by management of Gadberry to advise on cash flow
reporting. Management is concerned about the relatively small net
increase in cash, and how the company is doing compared to
competitors Nessly and Tootsey. The following Tableau Dashboard
will assist in our analysis.Gadberry (green) Operating Activities:
$40,000Nessly (Red) Investing Activites: $15,000Nessly (Orange) Financing: $25,000Tootsey (Green) Operating Activities:
$10,000Gadberry (Red) Investing Activities:
$(4,000)Gadberry (Orange) Financing Activities:
$(34,000)Nessly (Green) Operating Activites:...
We were unable to transcribe this image$(10,000) $(20,000) Cash Outflows $(30,000) $(40,000) Operating Activities Investing Activities...
 We were unable to transcribe this image$(10,000) $(20,000) Cash Outflows $(30,000) $(40,000) Operating Activities Investing Activities Financing Activities $(50,000) Net Income (Loss) for Competing Companies Gadberry Nessly Tootsey $(40,000) $(30,000) $(20,000) $(10,000) $0 $10,000 $20,000 $30,000 $40,000 Net Loss Net Income tableau < » K og Po 1. Which company generates the most cash inflow from operating activities? 2. Which of these companies report “Net cash used in investing activities”? 3. Calculate the total net increase or decrease in cash...
1. Which company generates the most cash inflow from operating activities?
 1. Which company generates the most cash inflow from operating activities? 2. Which of these companies report "Net cash used in investing activities"? 3. Calculate the total net increase or decrease in cash for (a) Gadberry, (b) Nessly, and (c) Tootsey.
REQ 1 and 2 are decreased/increase. As consultants, we are hired to help the company track...
 REQ 1 and 2 are
decreased/increase.
As consultants, we are hired to help the company track and report costs. The following Tableau Dashboard is provided to assist us in our analysis. Inventories Work in Process Raw Materials Finished Goods S21.000 S18,000 $15.000 $12.000 $9,000 56,000 $3,000 $0 November 30 December 31 November 30 December 31 November 30 December 31 Factory Overhead for December Sales, Materials, and Payroll for December Indirect materials Indirect labor Factory payroll Raw materials purchases Total Overhead...
REQ 1 and 2 are
decreased/increase.
As consultants, we are hired to help the company track and report costs. The following Tableau Dashboard is provided to assist us in our analysis. Inventories Work in Process Raw Materials Finished Goods S21.000 S18,000 $15.000 $12.000 $9,000 56,000 $3,000 $0 November 30 December 31 November 30 December 31 November 30 December 31 Factory Overhead for December Sales, Materials, and Payroll for December Indirect materials Indirect labor Factory payroll Raw materials purchases Total Overhead...
2. Asset management ratios Asset management ratios are used to measure how effectively a firm manages...
 2. Asset management ratios Asset management ratios are used to measure how effectively a firm manages its assets, by relating the amount a firm has invested in a particular type of asset (or group of assets) to the amount of revenues the asset is generating. Examples of asset management ratios include the average collection pericod (also called the days sales outstanding ratio), the inventory turnover ratio, the fixed asset turnover ratio, and the total asset turnover ratio. Consider the following...
3. Asset management ratios Asset management ratios are used to measure how effectively a firm manages...
3. Asset management ratios Asset management ratios are used to measure how effectively a firm manages its assets, by relating the amount a firm has invested in a particular type of asset (or group of assets) to the amount of revenues the asset is generating. Examples of asset management ratios include the average collection period (also called the days sales outstanding ratio), the inventory turnover ratio, the fixed asset turnover ratio, and the total asset turnover ratio. Consider the following...
3. Asset management ratios Asset management ratios are used to measure how effectively a firm manages...
 3. Asset management ratios Asset management ratios are used to measure how effectively a firm manages its assets, by relating the amount a firm has invested in a particular type of asset (or group of assets) to the amount of revenues the asset is generating. Examples of asset management ratios include the average collection period (also called the days sales outstanding ratio), the inventory turnover ratio, the fixed asset turnover ratio, and the total asset turnover ratio. Consider the following...
Asset management ratios are used to measure how effectively a firm manages its assets, by relating...
 Asset management ratios are used to measure how effectively a firm manages its assets, by relating the amount a firm has invested in a particular type of asset (or group of assets) to the amount of revenues the asset is generating. Examples of asset management ratios include the average collection period (also called the days sales outstanding ratio), the inventory turnover ratio, the fixed asset turnover ratio, and the total asset turnover ratio. Consider the following case: Polk Software Inc....
Correctly answer is part of question 3 Aa Aa 3. Asset management ratios Asset management ratios...
 Correctly answer is part of question 3
Aa Aa 3. Asset management ratios Asset management ratios are used to measure how effectively a firm manages its assets, by relating the amount a firm has invested in a particular type of asset (or group of assets) to the amount of revenues the asset is generating. Examples of asset management ratios include the average collection period (also called the days sales outstanding ratio), the inventory turnover ratio, the fixed asset turnover ratio,...
Correctly answer is part of question 3
Aa Aa 3. Asset management ratios Asset management ratios are used to measure how effectively a firm manages its assets, by relating the amount a firm has invested in a particular type of asset (or group of assets) to the amount of revenues the asset is generating. Examples of asset management ratios include the average collection period (also called the days sales outstanding ratio), the inventory turnover ratio, the fixed asset turnover ratio,...
Problem 4 Look at the data from three different companies for the last year. The companies...
 Problem 4 Look at the data from three different companies for the last year. The companies are in the same industry and have been in business for several years. Amanda Co. Casey Co. ($24,000) Sarah Co. Cash provided (used) by operating activities Cash provided (used) by investing activities Proceeds from sale of plant assets Purchase of plant assets Cash provided (used) by financing activities $90,000 $40,000 $26,000 ($48,000) ($25,000) Proceeds from issuance of debt $13,000 Repayment of debt Net increase...
 As consultants in advisory services at an accounting firm, we
are hired by management of Gadberry to advise on cash flow
reporting. Management is concerned about the relatively small net
increase in cash, and how the company is doing compared to
competitors Nessly and Tootsey. The following Tableau Dashboard
will assist in our analysis.Gadberry (green) Operating Activities:
$40,000Nessly (Red) Investing Activites: $15,000Nessly (Orange) Financing: $25,000Tootsey (Green) Operating Activities:
$10,000Gadberry (Red) Investing Activities:
$(4,000)Gadberry (Orange) Financing Activities:
$(34,000)Nessly (Green) Operating Activites:...
As consultants in advisory services at an accounting firm, we
are hired by management of Gadberry to advise on cash flow
reporting. Management is concerned about the relatively small net
increase in cash, and how the company is doing compared to
competitors Nessly and Tootsey. The following Tableau Dashboard
will assist in our analysis.Gadberry (green) Operating Activities:
$40,000Nessly (Red) Investing Activites: $15,000Nessly (Orange) Financing: $25,000Tootsey (Green) Operating Activities:
$10,000Gadberry (Red) Investing Activities:
$(4,000)Gadberry (Orange) Financing Activities:
$(34,000)Nessly (Green) Operating Activites:...
 We were unable to transcribe this image$(10,000) $(20,000) Cash Outflows $(30,000) $(40,000) Operating Activities Investing Activities Financing Activities $(50,000) Net Income (Loss) for Competing Companies Gadberry Nessly Tootsey $(40,000) $(30,000) $(20,000) $(10,000) $0 $10,000 $20,000 $30,000 $40,000 Net Loss Net Income tableau < » K og Po 1. Which company generates the most cash inflow from operating activities? 2. Which of these companies report “Net cash used in investing activities”? 3. Calculate the total net increase or decrease in cash...
 1. Which company generates the most cash inflow from operating activities? 2. Which of these companies report "Net cash used in investing activities"? 3. Calculate the total net increase or decrease in cash for (a) Gadberry, (b) Nessly, and (c) Tootsey.
 REQ 1 and 2 are
decreased/increase.
As consultants, we are hired to help the company track and report costs. The following Tableau Dashboard is provided to assist us in our analysis. Inventories Work in Process Raw Materials Finished Goods S21.000 S18,000 $15.000 $12.000 $9,000 56,000 $3,000 $0 November 30 December 31 November 30 December 31 November 30 December 31 Factory Overhead for December Sales, Materials, and Payroll for December Indirect materials Indirect labor Factory payroll Raw materials purchases Total Overhead...
REQ 1 and 2 are
decreased/increase.
As consultants, we are hired to help the company track and report costs. The following Tableau Dashboard is provided to assist us in our analysis. Inventories Work in Process Raw Materials Finished Goods S21.000 S18,000 $15.000 $12.000 $9,000 56,000 $3,000 $0 November 30 December 31 November 30 December 31 November 30 December 31 Factory Overhead for December Sales, Materials, and Payroll for December Indirect materials Indirect labor Factory payroll Raw materials purchases Total Overhead...
 2. Asset management ratios Asset management ratios are used to measure how effectively a firm manages its assets, by relating the amount a firm has invested in a particular type of asset (or group of assets) to the amount of revenues the asset is generating. Examples of asset management ratios include the average collection pericod (also called the days sales outstanding ratio), the inventory turnover ratio, the fixed asset turnover ratio, and the total asset turnover ratio. Consider the following...
 3. Asset management ratios Asset management ratios are used to measure how effectively a firm manages its assets, by relating the amount a firm has invested in a particular type of asset (or group of assets) to the amount of revenues the asset is generating. Examples of asset management ratios include the average collection period (also called the days sales outstanding ratio), the inventory turnover ratio, the fixed asset turnover ratio, and the total asset turnover ratio. Consider the following...
 Asset management ratios are used to measure how effectively a firm manages its assets, by relating the amount a firm has invested in a particular type of asset (or group of assets) to the amount of revenues the asset is generating. Examples of asset management ratios include the average collection period (also called the days sales outstanding ratio), the inventory turnover ratio, the fixed asset turnover ratio, and the total asset turnover ratio. Consider the following case: Polk Software Inc....
 Correctly answer is part of question 3
Aa Aa 3. Asset management ratios Asset management ratios are used to measure how effectively a firm manages its assets, by relating the amount a firm has invested in a particular type of asset (or group of assets) to the amount of revenues the asset is generating. Examples of asset management ratios include the average collection period (also called the days sales outstanding ratio), the inventory turnover ratio, the fixed asset turnover ratio,...
Correctly answer is part of question 3
Aa Aa 3. Asset management ratios Asset management ratios are used to measure how effectively a firm manages its assets, by relating the amount a firm has invested in a particular type of asset (or group of assets) to the amount of revenues the asset is generating. Examples of asset management ratios include the average collection period (also called the days sales outstanding ratio), the inventory turnover ratio, the fixed asset turnover ratio,...
 Problem 4 Look at the data from three different companies for the last year. The companies are in the same industry and have been in business for several years. Amanda Co. Casey Co. ($24,000) Sarah Co. Cash provided (used) by operating activities Cash provided (used) by investing activities Proceeds from sale of plant assets Purchase of plant assets Cash provided (used) by financing activities $90,000 $40,000 $26,000 ($48,000) ($25,000) Proceeds from issuance of debt $13,000 Repayment of debt Net increase...
Most questions answered within 3 hours.
-
Where is the error in this code sequence?
String s1 = "Hello";
String s2 = "ello";...
asked 10 months ago -
Financial data for Joel de Paris, Inc., for last year
follow:
Joel de Paris, Inc.
Balance...
asked 10 months ago -
Consider this reaction:
Al2(SO4)3 (aq)+ BaCl3
(aq) Al2Cl6 (aq)- +
3BaSO4(s) . What is the...
asked 10 months ago -
Suppose that Savneet is considering increasing her
recent random sample from 20 car rentals to 40...
asked 10 months ago -
Trucks arrive at an unloading terminal at an average rate of 120
per hour.
Trucks arrive...
asked 10 months ago -
Why are methanol and ethanol completely soluble in water while
octanol is not very little soluble....
asked 10 months ago -
A facilities manager at a university reads in a research report
that the mean amount of...
asked 10 months ago -
When the CuSO4 is rehydrated by adding water to the anhydrous
compound, is this an endothermic...
asked 10 months ago -
A ray of sunlight is passing from diamond into crown glass; the
angle of incidence is...
asked 10 months ago -
A block of mass 0.249 kg is placed on top of a light, vertical
spring of...
asked 10 months ago -
how do the kidneys compensate in the presences of acidosis
a) trigger hyperventilate
b) reserve acid...
asked 10 months ago -
Question 501 pts
The rental rate of capital to the firm increases. Which of the
following...
asked 10 months ago