
Homework Answers
| Q | TC=2Q2 | TFC | TVC=TC-TVC | AVC=TVC/Q | ATC=TC/Q | MC=4*Q |
| 0 | 0 | 0 | 0 | |||
| 1 | 2 | 0 | 2 | 2 | 2 | 4 |
| 2 | 8 | 0 | 8 | 4 | 4 | 8 |
| 3 | 18 | 0 | 18 | 6 | 6 | 12 |
| 4 | 32 | 0 | 32 | 8 | 8 | 16 |
| 5 | 50 | 0 | 50 | 10 | 10 | 20 |
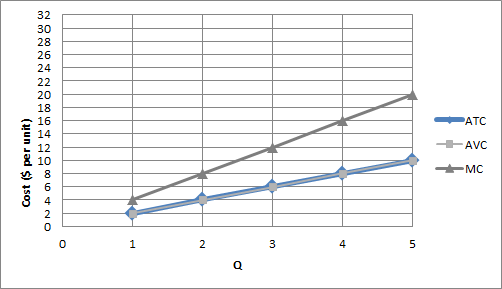
Fixed cost is zero in this case. So, ATC=AVC. It is why ATC and AVC lines are superimposed.
Add Answer to:
suppose a firm's total cost of production (TC) is tc=2Q^2
mc=4Q
Suppose a firm's total cost...
Suppose a fim's total cost of production (TC) is TC = 2.202 MC = 4.40 What...
 Suppose a fim's total cost of production (TC) is TC = 2.202 MC = 4.40 What do the firm's average total cost curve, average variable cost curve, and marginal cost curve look like? Draw the following curves from 0 to 5 units of output. Cost (dollars per unit) 1.) Using the line drawing tool, graph the firm's average total cost curve and label it ATC'. 2.) Using the line drawing tool, graph the firm's average variable cost curve and label...
The graph to the right depicts the average cost curves and the marginal cost curve for...
 The graph to the right depicts the average cost curves and the marginal cost curve for a typical firm in a competitive industry. 1.) Using the line drawing fool, draw the firm's demand curve at a market price such that the firm is breaking even. Label your curved, 2.) Using the line drawing tool, draw the firm's demand curve at a market price such that the firm is at its shutdown price. Label your curved, Carefully follow the instructions above,...
A monopoly has a constant marginal cost of production of $2 per unit and no fixed...
 A monopoly has a constant marginal cost of production of $2 per unit and no fixed costs. In the figure to the right, let D be demand and MR be marginal revenue. TTT 1.) Using the line drawing tool, graph the monopoly's marginal cost curve. Label this curve 'MC.' 2.) Using the line drawing tool, graph the monopoly's average variable cost curve. Label this curve 'AVC.' p, $ per unit 3.) Using the line drawing tool, graph the monopoly's average...
Amonopoly has a constant marginal cost of production of $2 per unit and no foed costs In the figure to the right, l...
 Amonopoly has a constant marginal cost of production of $2 per unit and no foed costs In the figure to the right, let D be demand and MR be marginal revenue ed 1.) Using the line drawing tool, graph the monopoly's marginal cost curve Label this curve 'MC 2) Using the line drawing tool graph the monopoly's average variable cost curve Label this curve 'AVC 3.) Using the line drawing tool graph the monopoly's average cost curve Label this curve...
Suppose the firm’s total cost and marginal cost functions are given by TC=54+Q+2Q^3 and MC=1+4Q^2, respectively....
Suppose the firm’s total cost and marginal cost functions are given by TC=54+Q+2Q^3 and MC=1+4Q^2, respectively. What is the output level that minimizes average total cost? A. 2 B. 3 C. 6 D. 8
A monopoly has a constant marginal cost of production of $4 per unit and no fixed...
 A monopoly has a constant marginal cost of production of $4 per unit and no fixed costs. In the figure to the right, let D be demand and MR be marginal revenue. 1.) Using the line drawing tool graph the monopoly's marginal cost curve. Label this curve 'MC! 2.) Using the line drawing tool, graph the monopoly's average variable cost curve. Label this curve 'AVC.' 3.) Using the line drawing tool, graph the monopoly's average cost curve. Label this curve...
3) Suppose the cost curve for a firm producing sneakers is TC 1010 q - 4q-...
 3) Suppose the cost curve for a firm producing sneakers is TC 1010 q - 4q- + 3.1 (10 points) What are the firm's fixed costs, variable costs, average costs, average fixed cost, average variable costs, and marginal costs? 3.2 (10 points) Graph all 7 cost functions (TC, VC, FC, AC, AVC, AFC, MC) for quantities q 0 to q 10. You can use the Excel program to generate these graphs, plot C, VC, and FC in one graph and...
The top graph below shows the marginal cost (MC), average variable cost (AVC), and average total...
 The top graph below shows the marginal cost (MC), average variable cost (AVC), and average total cost (ATC) curves for an individual firm in a competitive commercial ridesharing market where the price has stabilized. In the blank graph below it, use the straight-line tool to draw the long-run market supply curve as a line from one edge of the graph to the other.
The curves show the marginal cost (MC), average variable cost (AVC), and average total cost (ATC)...
 The curves show the marginal cost (MC), average variable cost (AVC), and average total cost (ATC) functions for a firm in a competitive market. Using the straight-line tool, draw a straight line, all the way from the left edge of the graph to the right edge, to represent the minimum price at which the firm should continue operating.
The graph below shows the marginal cost (MC), average variable cost (AVC), and average total cost (ATC) curves for a firm in a competitive market. These curves imply a short-run supply curve that has two distinct parts. One part, not shown, lies along the
 The graph below shows the marginal cost (MC), average variable cost (AVC), and average total cost (ATC) curves for a firm in a competitive market. These curves imply a short-run supply curve that has two distinct parts. One part, not shown, lies along the vertical axis (quantity = 0); this represents a condition of production shutdown. Where is the other part? Use the straight-line tool to draw it.
 Suppose a fim's total cost of production (TC) is TC = 2.202 MC = 4.40 What do the firm's average total cost curve, average variable cost curve, and marginal cost curve look like? Draw the following curves from 0 to 5 units of output. Cost (dollars per unit) 1.) Using the line drawing tool, graph the firm's average total cost curve and label it ATC'. 2.) Using the line drawing tool, graph the firm's average variable cost curve and label...
 The graph to the right depicts the average cost curves and the marginal cost curve for a typical firm in a competitive industry. 1.) Using the line drawing fool, draw the firm's demand curve at a market price such that the firm is breaking even. Label your curved, 2.) Using the line drawing tool, draw the firm's demand curve at a market price such that the firm is at its shutdown price. Label your curved, Carefully follow the instructions above,...
 A monopoly has a constant marginal cost of production of $2 per unit and no fixed costs. In the figure to the right, let D be demand and MR be marginal revenue. TTT 1.) Using the line drawing tool, graph the monopoly's marginal cost curve. Label this curve 'MC.' 2.) Using the line drawing tool, graph the monopoly's average variable cost curve. Label this curve 'AVC.' p, $ per unit 3.) Using the line drawing tool, graph the monopoly's average...
 Amonopoly has a constant marginal cost of production of $2 per unit and no foed costs In the figure to the right, let D be demand and MR be marginal revenue ed 1.) Using the line drawing tool, graph the monopoly's marginal cost curve Label this curve 'MC 2) Using the line drawing tool graph the monopoly's average variable cost curve Label this curve 'AVC 3.) Using the line drawing tool graph the monopoly's average cost curve Label this curve...
 A monopoly has a constant marginal cost of production of $4 per unit and no fixed costs. In the figure to the right, let D be demand and MR be marginal revenue. 1.) Using the line drawing tool graph the monopoly's marginal cost curve. Label this curve 'MC! 2.) Using the line drawing tool, graph the monopoly's average variable cost curve. Label this curve 'AVC.' 3.) Using the line drawing tool, graph the monopoly's average cost curve. Label this curve...
 3) Suppose the cost curve for a firm producing sneakers is TC 1010 q - 4q- + 3.1 (10 points) What are the firm's fixed costs, variable costs, average costs, average fixed cost, average variable costs, and marginal costs? 3.2 (10 points) Graph all 7 cost functions (TC, VC, FC, AC, AVC, AFC, MC) for quantities q 0 to q 10. You can use the Excel program to generate these graphs, plot C, VC, and FC in one graph and...
 The top graph below shows the marginal cost (MC), average variable cost (AVC), and average total cost (ATC) curves for an individual firm in a competitive commercial ridesharing market where the price has stabilized. In the blank graph below it, use the straight-line tool to draw the long-run market supply curve as a line from one edge of the graph to the other.
 The curves show the marginal cost (MC), average variable cost (AVC), and average total cost (ATC) functions for a firm in a competitive market. Using the straight-line tool, draw a straight line, all the way from the left edge of the graph to the right edge, to represent the minimum price at which the firm should continue operating.
Most questions answered within 3 hours.
-
Where is the error in this code sequence?
String s1 = "Hello";
String s2 = "ello";...
asked 11 months ago -
Financial data for Joel de Paris, Inc., for last year
follow:
Joel de Paris, Inc.
Balance...
asked 11 months ago -
Consider this reaction:
Al2(SO4)3 (aq)+ BaCl3
(aq) Al2Cl6 (aq)- +
3BaSO4(s) . What is the...
asked 11 months ago -
Suppose that Savneet is considering increasing her
recent random sample from 20 car rentals to 40...
asked 11 months ago -
Trucks arrive at an unloading terminal at an average rate of 120
per hour.
Trucks arrive...
asked 11 months ago -
Why are methanol and ethanol completely soluble in water while
octanol is not very little soluble....
asked 11 months ago -
A facilities manager at a university reads in a research report
that the mean amount of...
asked 11 months ago -
When the CuSO4 is rehydrated by adding water to the anhydrous
compound, is this an endothermic...
asked 11 months ago -
A ray of sunlight is passing from diamond into crown glass; the
angle of incidence is...
asked 11 months ago -
A block of mass 0.249 kg is placed on top of a light, vertical
spring of...
asked 11 months ago -
how do the kidneys compensate in the presences of acidosis
a) trigger hyperventilate
b) reserve acid...
asked 11 months ago -
Question 501 pts
The rental rate of capital to the firm increases. Which of the
following...
asked 11 months ago