1. Two countries produce and consume T-shirts: the US and the ROW. The following table gives the supply and demand schedules for T-shirts for the two countries.

Note: Quantities are in millions and the supply and demand curves are straight lines over the range of prices given in the table. Be sure to label the relevant prices and quantities, including the P-intercepts.
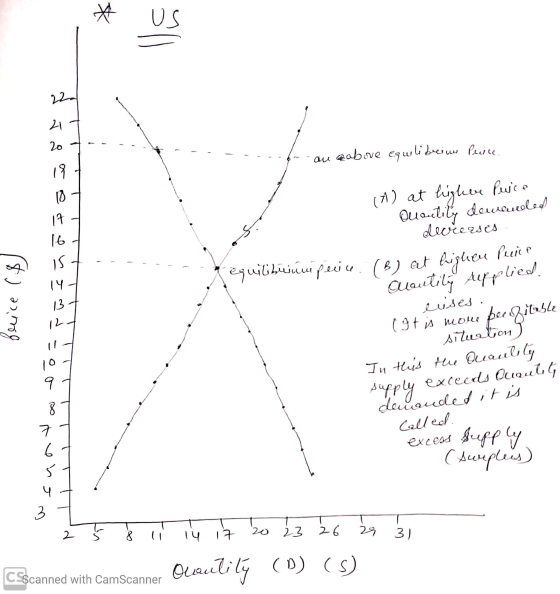
a. (3 points each.) Draw the appropriate supply and demand diagrams under the assumption that there is free trade between the two countries for
i. The US market.
ii. The ROW market.
iii. The international market.
b. (3 points each.) Draw the appropriate supply and demand diagrams under the assumption that the US has imposed a $5 tariff on imports from the ROW.
i. The US market.
ii. The ROW market.
iii. The international market.
c. What net impact does the $5 tariff have on ROW welfare? (Give a $ value.)
d. What net impact does the $5 tariff have on world welfare? (Give
a $ value.)
Homework Answers

Add Answer to:
1. Two countries produce and consume T-shirts: the US and the
ROW. The following table gives...
Two countries produce and consume T-shirts: the US and the ROW. Problems 1-2 are based on...
 Two countries produce and consume T-shirts: the US and the ROW. Problems 1-2 are based on the supply and demand schedules for the two countries given below. Note: The supply and demand curves are straight lines. Quantities are in millions of T-shirts. US ROW 32 13 28 26 10 20 18 12 12 13 14 15 This problem asks you to characterize the equilibrium under autarky and with trade. a. Draw the supply and demand curves for the US market...
Two countries produce and consume T-shirts: the US and the ROW. Problems 1-2 are based on...
 Two countries produce and consume T-shirts: the US and the ROW. Problems 1-2 are based on the supply and demand schedules for the two countries given below. Note: The supply and demand curves are straight lines. Quantities are in millions of T-shirts. US ROW 32 13 28 26 10 18 12 12 13 10 13 14 15 16 Suppose that the two countries open to trade. Describe an arbitrage strategy that will allow you to profit from the price differential...
Two countries produce and consume T-shirts: the US and the ROW. Problems 1-2 are based on...
 Two countries produce and consume T-shirts: the US and the ROW. Problems 1-2 are based on the supply and demand schedules for the two countries given below. Note: The supply and demand curves are straight lines. Quantities are in millions of T-shirts. US ROW 32 13 28 26 10 20 18 12 12 13 14 15 This problem asks you to examine the welfare effects of opening trade between the two countries. Please draw new graphs (separate from question I)....
The diagram above represents the market for T-shirts in the US, a small country. Vietnam can...
 The diagram above represents the market for T-shirts in the US,
a small country. Vietnam can produce T-shirts at a constant cost of
$6 per T-shirt. Mexico can produce T-shirts at a constant cost of
$7 per T- shirt. Initially, the US has a $4 tariff per T-shirt. US
consumers regard T-shirts made in the US, Vietnam, and Mexico as
identical.
From which country will the US import T-shirts? Briefly
explain
Draw a supply and demand diagram for the US...
The diagram above represents the market for T-shirts in the US,
a small country. Vietnam can produce T-shirts at a constant cost of
$6 per T-shirt. Mexico can produce T-shirts at a constant cost of
$7 per T- shirt. Initially, the US has a $4 tariff per T-shirt. US
consumers regard T-shirts made in the US, Vietnam, and Mexico as
identical.
From which country will the US import T-shirts? Briefly
explain
Draw a supply and demand diagram for the US...
a. Draw the supply and demand curves for the US market under autarky (no trade) Note...
 a. Draw the supply and demand curves for the US market under autarky (no trade) Note the equilibrium price and quantity b. Draw the supply and demand curves for the ROW market under autarky (no trade). Note the equilibrium price and quantity. Suppose that the two countries open to trade. Describe an arbitrage strategy that will allow you to profit from the price differential between the two markets. Be sure to explain how it will work d. Draw the import...
Two countries produce and consume T-shirts. This question is based on the international market depicted on...
 Two countries produce and consume T-shirts. This question is based on the international market depicted on the right. Assume transportation costs are $18. a. What is the price in the importing country? b. What is the price in the exporting country? c. What is the volume of trade? d. How much is spent on transporting T-shirts between the two countries? (Give a $ value.) e. How much does the exporting country gain from trade? (Give a $ value.) P ($)...
The diagram below represents the market for boxes of copy paper in a small country. Assume...
 The diagram below represents the market for boxes of
copy paper in a small country. Assume that the world price of a box
of copy paper is $40.
a. Redraw the supply and demand diagram for the domestic market
under free trade. Label the relevant prices and quantities, i.e.,
the domestic price, production, and consumption.
b. Draw a supply and demand diagram for the international market
under free trade. Label the relevant prices and quantities, i.e.,
the P-axis intercepts, international...
The diagram below represents the market for boxes of
copy paper in a small country. Assume that the world price of a box
of copy paper is $40.
a. Redraw the supply and demand diagram for the domestic market
under free trade. Label the relevant prices and quantities, i.e.,
the domestic price, production, and consumption.
b. Draw a supply and demand diagram for the international market
under free trade. Label the relevant prices and quantities, i.e.,
the P-axis intercepts, international...
There are two countries (Country X and Country Y) and two goods (T-shirts and calculators). Country...
 There are two countries (Country X and Country Y) and two goods
(T-shirts and calculators). Country X imports T-shirts and exports
calculators and Country Y exports T-shirts and imports calculators.
The diagram on the right depicts the international market for
T-shirts. A calculator costs $90.
Under free trade, what is Country X’s terms of trade? (Give a
numerical answer.)
If Country X imposes a $6 tariff on T- shirts, what are its new
terms of trade? (Give a numerical answer....
There are two countries (Country X and Country Y) and two goods
(T-shirts and calculators). Country X imports T-shirts and exports
calculators and Country Y exports T-shirts and imports calculators.
The diagram on the right depicts the international market for
T-shirts. A calculator costs $90.
Under free trade, what is Country X’s terms of trade? (Give a
numerical answer.)
If Country X imposes a $6 tariff on T- shirts, what are its new
terms of trade? (Give a numerical answer....
Consider a model world consisting of two countries: A and B. The countries trade some e good in the international market. The respective suppy and demand curves of the wP and are described by - 4...
 Consider a model world consisting of two countries: A and B. The countries trade some e good in the international market. The respective suppy and demand curves of the wP and are described by - 480-12P and Q 280+8P(for country Ay lar necessary either work B92+ 6P (for country B). Please answer the following questions; wheren with fractions or round to the fourth decimal place trade some generic (a) In the absence of international trade, find domestic equilibria in the...
P (S) 16 15 6 8 10 12 14 16 18 20 22 7 9 11...
 P (S) 16 15 6 8 10 12 14 16 18 20 22 7 9 11 13 15 17 19 21 (Thous) Figure 2 4. Figure 2 represents the market for T-shirts in Krugmania, a small country. Assume that there is free trade with the rest of the world (ROW). The world price of a T-shirt is S10 a.Draw the supply and demand diagram for Krug mania's domestic market with trade. Label the relevant prices and quantities, e.g., the domestic...
 Two countries produce and consume T-shirts: the US and the ROW. Problems 1-2 are based on the supply and demand schedules for the two countries given below. Note: The supply and demand curves are straight lines. Quantities are in millions of T-shirts. US ROW 32 13 28 26 10 20 18 12 12 13 14 15 This problem asks you to characterize the equilibrium under autarky and with trade. a. Draw the supply and demand curves for the US market...
 Two countries produce and consume T-shirts: the US and the ROW. Problems 1-2 are based on the supply and demand schedules for the two countries given below. Note: The supply and demand curves are straight lines. Quantities are in millions of T-shirts. US ROW 32 13 28 26 10 18 12 12 13 10 13 14 15 16 Suppose that the two countries open to trade. Describe an arbitrage strategy that will allow you to profit from the price differential...
 Two countries produce and consume T-shirts: the US and the ROW. Problems 1-2 are based on the supply and demand schedules for the two countries given below. Note: The supply and demand curves are straight lines. Quantities are in millions of T-shirts. US ROW 32 13 28 26 10 20 18 12 12 13 14 15 This problem asks you to examine the welfare effects of opening trade between the two countries. Please draw new graphs (separate from question I)....
 The diagram above represents the market for T-shirts in the US,
a small country. Vietnam can produce T-shirts at a constant cost of
$6 per T-shirt. Mexico can produce T-shirts at a constant cost of
$7 per T- shirt. Initially, the US has a $4 tariff per T-shirt. US
consumers regard T-shirts made in the US, Vietnam, and Mexico as
identical.
From which country will the US import T-shirts? Briefly
explain
Draw a supply and demand diagram for the US...
The diagram above represents the market for T-shirts in the US,
a small country. Vietnam can produce T-shirts at a constant cost of
$6 per T-shirt. Mexico can produce T-shirts at a constant cost of
$7 per T- shirt. Initially, the US has a $4 tariff per T-shirt. US
consumers regard T-shirts made in the US, Vietnam, and Mexico as
identical.
From which country will the US import T-shirts? Briefly
explain
Draw a supply and demand diagram for the US...
 a. Draw the supply and demand curves for the US market under autarky (no trade) Note the equilibrium price and quantity b. Draw the supply and demand curves for the ROW market under autarky (no trade). Note the equilibrium price and quantity. Suppose that the two countries open to trade. Describe an arbitrage strategy that will allow you to profit from the price differential between the two markets. Be sure to explain how it will work d. Draw the import...
 Two countries produce and consume T-shirts. This question is based on the international market depicted on the right. Assume transportation costs are $18. a. What is the price in the importing country? b. What is the price in the exporting country? c. What is the volume of trade? d. How much is spent on transporting T-shirts between the two countries? (Give a $ value.) e. How much does the exporting country gain from trade? (Give a $ value.) P ($)...
 The diagram below represents the market for boxes of
copy paper in a small country. Assume that the world price of a box
of copy paper is $40.
a. Redraw the supply and demand diagram for the domestic market
under free trade. Label the relevant prices and quantities, i.e.,
the domestic price, production, and consumption.
b. Draw a supply and demand diagram for the international market
under free trade. Label the relevant prices and quantities, i.e.,
the P-axis intercepts, international...
The diagram below represents the market for boxes of
copy paper in a small country. Assume that the world price of a box
of copy paper is $40.
a. Redraw the supply and demand diagram for the domestic market
under free trade. Label the relevant prices and quantities, i.e.,
the domestic price, production, and consumption.
b. Draw a supply and demand diagram for the international market
under free trade. Label the relevant prices and quantities, i.e.,
the P-axis intercepts, international...
 There are two countries (Country X and Country Y) and two goods
(T-shirts and calculators). Country X imports T-shirts and exports
calculators and Country Y exports T-shirts and imports calculators.
The diagram on the right depicts the international market for
T-shirts. A calculator costs $90.
Under free trade, what is Country X’s terms of trade? (Give a
numerical answer.)
If Country X imposes a $6 tariff on T- shirts, what are its new
terms of trade? (Give a numerical answer....
There are two countries (Country X and Country Y) and two goods
(T-shirts and calculators). Country X imports T-shirts and exports
calculators and Country Y exports T-shirts and imports calculators.
The diagram on the right depicts the international market for
T-shirts. A calculator costs $90.
Under free trade, what is Country X’s terms of trade? (Give a
numerical answer.)
If Country X imposes a $6 tariff on T- shirts, what are its new
terms of trade? (Give a numerical answer....
 Consider a model world consisting of two countries: A and B. The countries trade some e good in the international market. The respective suppy and demand curves of the wP and are described by - 480-12P and Q 280+8P(for country Ay lar necessary either work B92+ 6P (for country B). Please answer the following questions; wheren with fractions or round to the fourth decimal place trade some generic (a) In the absence of international trade, find domestic equilibria in the...
 P (S) 16 15 6 8 10 12 14 16 18 20 22 7 9 11 13 15 17 19 21 (Thous) Figure 2 4. Figure 2 represents the market for T-shirts in Krugmania, a small country. Assume that there is free trade with the rest of the world (ROW). The world price of a T-shirt is S10 a.Draw the supply and demand diagram for Krug mania's domestic market with trade. Label the relevant prices and quantities, e.g., the domestic...
Most questions answered within 3 hours.
-
Where is the error in this code sequence?
String s1 = "Hello";
String s2 = "ello";...
asked 11 months ago -
Financial data for Joel de Paris, Inc., for last year
follow:
Joel de Paris, Inc.
Balance...
asked 11 months ago -
Consider this reaction:
Al2(SO4)3 (aq)+ BaCl3
(aq) Al2Cl6 (aq)- +
3BaSO4(s) . What is the...
asked 11 months ago -
Suppose that Savneet is considering increasing her
recent random sample from 20 car rentals to 40...
asked 11 months ago -
Trucks arrive at an unloading terminal at an average rate of 120
per hour.
Trucks arrive...
asked 11 months ago -
Why are methanol and ethanol completely soluble in water while
octanol is not very little soluble....
asked 11 months ago -
A facilities manager at a university reads in a research report
that the mean amount of...
asked 11 months ago -
When the CuSO4 is rehydrated by adding water to the anhydrous
compound, is this an endothermic...
asked 11 months ago -
A ray of sunlight is passing from diamond into crown glass; the
angle of incidence is...
asked 11 months ago -
A block of mass 0.249 kg is placed on top of a light, vertical
spring of...
asked 11 months ago -
how do the kidneys compensate in the presences of acidosis
a) trigger hyperventilate
b) reserve acid...
asked 11 months ago -
Question 501 pts
The rental rate of capital to the firm increases. Which of the
following...
asked 11 months ago