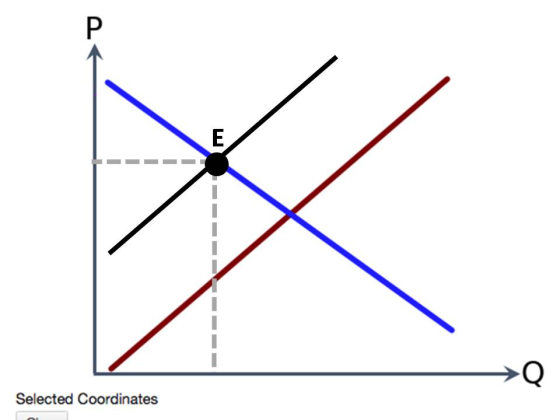
Suppose the Supply and Demand curves below represent the market for coffee. If a powerful hurricane destroys many coffee trees in the Caribbean, then CLICK ON THE GRAPH to mark at least one possible new equilibrium.

Homework Answers
Destruction of coffee trees will decrease supply of coffee, shifting supply curve leftward, which intersects original demand curve at point E with higher price and lower quantity.
Add Answer to:
Suppose the Supply and Demand curves below represent the market
for coffee. If a powerful hurricane...
[10 points] Suppose the market demand and market supply curves for coffee are given by the...
 [10 points] Suppose the market demand and market supply curves for coffee are given by the following equations where P is the price per cup of coffee and Qc is the quantity of billion cups of coffee: Market Demand for Coffee: QD = 120 – 6P Market Supply of Coffee: Qs = -10 + 20P a. [2 points) What is the equilibrium price and equilibrium of coffee given the above information? Suppose the quantity of coffee supplied at every price...
1. Suppose that the initial demand and supply curves for coffee are illustrate by D' and...
 1. Suppose that the initial demand and supply curves for coffee are illustrate by D' and St in the graph below. Assume that coffee and kringle are complements in consumption. Clearly label all additions to the graph. a) Suppose that the initial market price of coffee, Po, is $1 per cup (Po = $1). Determine and illustrate the quantity demanded at Po (labeled as Qc), and the quantity supplied at Po (labeled as Qoʻ). Show Qoand Qos on the quantity...
The graph below shows demand and supply curves for U.S. dollars in the foreign exchange market. As...
 The graph below shows demand and
supply curves for U.S. dollars in the foreign exchange
market. As you can see, the exchange rate (in terms of
foreign currency units per dollar) is initially equal to
E0.
Suppose that next year there’s
a huge increase in the number of foreigners – from Europe, China,
and everywhere else – who decide to visit the U.S. as
tourists.
How would this huge increase in tourism in the U.S. affect the
exchange rate? To answer this,...
The graph below shows demand and
supply curves for U.S. dollars in the foreign exchange
market. As you can see, the exchange rate (in terms of
foreign currency units per dollar) is initially equal to
E0.
Suppose that next year there’s
a huge increase in the number of foreigners – from Europe, China,
and everywhere else – who decide to visit the U.S. as
tourists.
How would this huge increase in tourism in the U.S. affect the
exchange rate? To answer this,...
Consider the market for gasoline Suppose the market demand and supply curves are as given below....
 Consider the market for gasoline Suppose the market demand and supply curves are as given below. In each case, quantity refers to millions of ihres of gasoline per month price is the price perire in Demand: P-300 - 160 Supply P 12040 Compute the equilibrium price and quantity The equilibrium quantity is 60 million tres(Enter your response rounded to one decimal place) The equilibrium price is cents per tre (Enter your response rounded to the nearest cent)
Consider a market for wheat. Suppose the supply and demand curves are linear, namely Supply: Qs...
Consider a market for wheat. Suppose the supply and demand curves are linear, namely Supply: Qs = 120 + 240P Demand: Qd = 300 - 120P a) (5%) What is the equilibrium price and quantity? b) (5%) What is the price elasticity of demand at the equilibrium? What is the price elasticity of supply at the equilibrium? For part c and d below, suppose that a drought changed the supply curve and the new equilibrium price is $1.00 per bushel....
The following formulas represent the demand and supply curves for corn: QD = 1,600 – 125...
The following formulas represent the demand and supply curves for corn: QD = 1,600 – 125 * P QS = 440 + 165 * P Calculate the equilibrium price and quantity in this market and illustrate this graphically. Suppose corn becomes less popular so the market demand curve is now given by QD = 1,020 – 125 * P. Calculate the new equilibrium price and quantity and illustrate the movement from the old equilibrium to the new one graphically.
2) Suppose that the demand and supply curves for a good are given by QD =...
2) Suppose that the demand and supply curves for a good are given by QD = (900/P) and QS = 4P. What is the equilibrium price and equilibrium quantity? Explain what is happening in the market at a price of $10 & Explain what is happening in the market at a price of $20. Please represent this market in a graph for price in equilibrium, when the price is $10 and when the price is $20.
not sure what equation to use to find the supply and demand curves Unit 7-Market Intervention:...
 not
sure what equation to use to find the supply and demand
curves
Unit 7-Market Intervention: Price Ceilings and Floors, Taxes Suppose that the demand curve for coffee is Q = 10-P and the supply curve is Q = P. Draw the supply and demand curves below. NWU1000 2 3 4 5 6 7 8 9 10 1. What is the equilibrium price and quantity? 2. What is total surplus, consumer surplus, and producer surplus? 3. Suppose the government implemented...
not
sure what equation to use to find the supply and demand
curves
Unit 7-Market Intervention: Price Ceilings and Floors, Taxes Suppose that the demand curve for coffee is Q = 10-P and the supply curve is Q = P. Draw the supply and demand curves below. NWU1000 2 3 4 5 6 7 8 9 10 1. What is the equilibrium price and quantity? 2. What is total surplus, consumer surplus, and producer surplus? 3. Suppose the government implemented...
Unit 7-Market Intervention: Price Ceilings and Floors, Taxes Suppose that the demand curve for coffee is...
 Unit 7-Market Intervention: Price Ceilings and Floors, Taxes Suppose that the demand curve for coffee is Q-10-P and the supply curve is Q = P. Draw the supply and demand curves below. 107 NWU 3 4 5 6 7 8 9 10 1. What is the equilibrium price and quantity? 2. What is total surplus, consumer surplus, and producer surplus? 3. Suppose the government implemented a price floor at $7 per cup of coffee. a. Identify the new quantities demanded...
Suppose these are the market demand and supply curves for hooded sweatshirts: Supply: P = 10...
Suppose these are the market demand and supply curves for hooded sweatshirts: Supply: P = 10 + 2QS Demand: P = 50−3QD (a) Sketch these two curves (that is, draw them, but don’t worry about numerical accuracy). Calculate equilibrium price and quantity. Calculate equilibrium price and quantity. (b) Show on your graph the areas of consumer and producer surplus. Calculate consumer and producer surplus at the equilibrium from part a. (c) Calculate the price elasticity of demand when price changes...
 [10 points] Suppose the market demand and market supply curves for coffee are given by the following equations where P is the price per cup of coffee and Qc is the quantity of billion cups of coffee: Market Demand for Coffee: QD = 120 – 6P Market Supply of Coffee: Qs = -10 + 20P a. [2 points) What is the equilibrium price and equilibrium of coffee given the above information? Suppose the quantity of coffee supplied at every price...
 1. Suppose that the initial demand and supply curves for coffee are illustrate by D' and St in the graph below. Assume that coffee and kringle are complements in consumption. Clearly label all additions to the graph. a) Suppose that the initial market price of coffee, Po, is $1 per cup (Po = $1). Determine and illustrate the quantity demanded at Po (labeled as Qc), and the quantity supplied at Po (labeled as Qoʻ). Show Qoand Qos on the quantity...
 The graph below shows demand and
supply curves for U.S. dollars in the foreign exchange
market. As you can see, the exchange rate (in terms of
foreign currency units per dollar) is initially equal to
E0.
Suppose that next year there’s
a huge increase in the number of foreigners – from Europe, China,
and everywhere else – who decide to visit the U.S. as
tourists.
How would this huge increase in tourism in the U.S. affect the
exchange rate? To answer this,...
The graph below shows demand and
supply curves for U.S. dollars in the foreign exchange
market. As you can see, the exchange rate (in terms of
foreign currency units per dollar) is initially equal to
E0.
Suppose that next year there’s
a huge increase in the number of foreigners – from Europe, China,
and everywhere else – who decide to visit the U.S. as
tourists.
How would this huge increase in tourism in the U.S. affect the
exchange rate? To answer this,...
 Consider the market for gasoline Suppose the market demand and supply curves are as given below. In each case, quantity refers to millions of ihres of gasoline per month price is the price perire in Demand: P-300 - 160 Supply P 12040 Compute the equilibrium price and quantity The equilibrium quantity is 60 million tres(Enter your response rounded to one decimal place) The equilibrium price is cents per tre (Enter your response rounded to the nearest cent)
 not
sure what equation to use to find the supply and demand
curves
Unit 7-Market Intervention: Price Ceilings and Floors, Taxes Suppose that the demand curve for coffee is Q = 10-P and the supply curve is Q = P. Draw the supply and demand curves below. NWU1000 2 3 4 5 6 7 8 9 10 1. What is the equilibrium price and quantity? 2. What is total surplus, consumer surplus, and producer surplus? 3. Suppose the government implemented...
not
sure what equation to use to find the supply and demand
curves
Unit 7-Market Intervention: Price Ceilings and Floors, Taxes Suppose that the demand curve for coffee is Q = 10-P and the supply curve is Q = P. Draw the supply and demand curves below. NWU1000 2 3 4 5 6 7 8 9 10 1. What is the equilibrium price and quantity? 2. What is total surplus, consumer surplus, and producer surplus? 3. Suppose the government implemented...
 Unit 7-Market Intervention: Price Ceilings and Floors, Taxes Suppose that the demand curve for coffee is Q-10-P and the supply curve is Q = P. Draw the supply and demand curves below. 107 NWU 3 4 5 6 7 8 9 10 1. What is the equilibrium price and quantity? 2. What is total surplus, consumer surplus, and producer surplus? 3. Suppose the government implemented a price floor at $7 per cup of coffee. a. Identify the new quantities demanded...
Most questions answered within 3 hours.
-
Where is the error in this code sequence?
String s1 = "Hello";
String s2 = "ello";...
asked 10 months ago -
Financial data for Joel de Paris, Inc., for last year
follow:
Joel de Paris, Inc.
Balance...
asked 10 months ago -
Consider this reaction:
Al2(SO4)3 (aq)+ BaCl3
(aq) Al2Cl6 (aq)- +
3BaSO4(s) . What is the...
asked 10 months ago -
Suppose that Savneet is considering increasing her
recent random sample from 20 car rentals to 40...
asked 10 months ago -
Trucks arrive at an unloading terminal at an average rate of 120
per hour.
Trucks arrive...
asked 10 months ago -
Why are methanol and ethanol completely soluble in water while
octanol is not very little soluble....
asked 10 months ago -
A facilities manager at a university reads in a research report
that the mean amount of...
asked 10 months ago -
When the CuSO4 is rehydrated by adding water to the anhydrous
compound, is this an endothermic...
asked 10 months ago -
A ray of sunlight is passing from diamond into crown glass; the
angle of incidence is...
asked 10 months ago -
A block of mass 0.249 kg is placed on top of a light, vertical
spring of...
asked 10 months ago -
how do the kidneys compensate in the presences of acidosis
a) trigger hyperventilate
b) reserve acid...
asked 10 months ago -
Question 501 pts
The rental rate of capital to the firm increases. Which of the
following...
asked 10 months ago