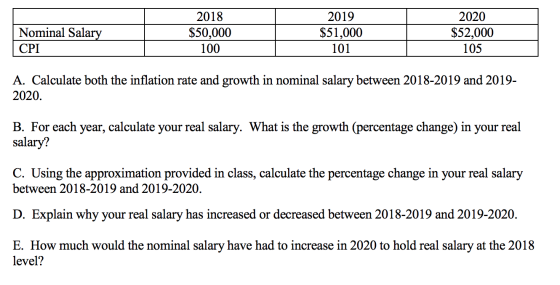
You are given the following information about your nominal salary and the CPI . (For numerical answers below, circle your answers or put them in a table.)
Homework Answers
![a) Inflation = [[(CPI(Year 2) – CPI(Year 1)] / CPI ( Year 1)] x 100 Growth in nominal salary = [[(Salary(Year 2) – Salary (Ye](http://img.homeworklib.com/questions/d40e4a80-7878-11ea-ace2-fde5376e89fb.png?x-oss-process=image/resize,w_560)

Add Answer to:
You are given the following information about your nominal
salary and the CPI . (For numerical...
In 1990 an individual earned $20,111 and the CPI had a value of 180. In 2018...
In 1990 an individual earned $20,111 and the CPI had a value of 180. In 2018 the same individual earned $37,241 and the CPI in 2018 had a value of 224. Calculate the percentage change in the individual's real (inflation adjusted) income. Round your answers to two decimal places.
According to the New Hampshire Department of Education, the average teacher salary in public school districts...
 According to the New Hampshire Department of Education, the average teacher salary in public school districts in New Hampshire was $45,166 in 2006, $46,670 in 2007, and $45,166 in 2008. Use the following information on CPI and PPI. Year CPI (1982 - 84 = 100) 201.59 164.80 207.34 PPI (1982 - 100) 2006 2007 2008 2009 215.30 214.54 172.70 189.60 172.90 Source: Bureau of Labor Statistics. a. Calculate the real salary for the teachers. (Round your answers to 2 decimal...
The table below shows the GDP deflator and the CPI over the past five years. By...
 The table below shows the GDP deflator and the CPI over the past five years. By what percentage did prices change between years for each measure? Instructions: Enter your answers as percentages rounded to two decimal places. Year Change in GDP deflator CPI GDP deflator 100 Change in CPI 2015 2016 105 100 104 110 113 2017 2018 2019 2015-2019 112 123 128 122
According to the New Hampshire Department of Education, the average teacher salary in public school districts...
 According to the New Hampshire Department of Education, the average teacher salary in public school districts in New Hampshire was $47,035 in 2006, $48,482 in 2007, and $47,035 in 2008. Use the following information on CPI and PPI. 100) Year 2006 2007 2008 2009 CPI (1982 84 = 100) 201.59 207.34 215.30 214.54 PPI (1982 164.80 172.70 189.60 172.90 Source: Bureau of Labor Statistics. a. Calculate the real salary for the teachers. (Round your answers to 2 decimal places.) Year...
According to the New Hampshire Department of Education, the average teacher salary in public school districts...
 According to the New Hampshire Department of Education, the average teacher salary in public school districts in New Hampshire was $47,650 in 2006, $49,151 in 2007, and $47,650 in 2008. Use the following information on CPI and PPI. Year 2006 2007 2008 2009 CPI (1982 – 84 = 100) 201.59 207.34 215.30 214.54 PPI (1982 = 100) 164.80 172.70 189.60 172.90 Source: Bureau of Labor Statistics. a. Calculate the real salary for the teachers. (Round your answers to 2 decimal...
According to the New Hampshire Department of Education, the average teacher salary in public school districts...
 According to the New Hampshire Department of Education, the average teacher salary in public school districts in New Hampshire was $47,473 in 2006, $49,065 in 2007, and $47,473 in 2008. Use the following information on CPI and PPL. Year CPI (1982 - 84 100) PPI (1982 100) 2006 201.59 164.80 172.70 215.30 2009 207.34 2007 2008 214.54 189.60 172.90 Source: Bureau of Labor Statistics. a. Calculate the real salary for the teachers. (Round your answers to 2 decimal places.) Real...
According to the New Hampshire Department of Education, the average teacher salary in public school districts...
 According to the New Hampshire Department of Education, the average teacher salary in public school districts in New Hampshi was $47,473 in 2006, $49,065 in 2007, and $47,473 in 2008. Use the following information on CPI and PPI. Year CPI (1982 - 84 - 100) 2006 201.59 2007 207.34 2008 215.30 2009 214.54 PPI (1982 - 100) 164.80 172.70 189.60 172.90 Source: Bureau of Labor Statistics. a. Calculate the real salary for the teachers. (Round your answers to 2 decimal...
Problem Set 1 EC 202, Winter 2020 University of Oregon points total) Below is a schedule...
 Problem Set 1 EC 202, Winter 2020 University of Oregon points total) Below is a schedule for the prices and quantities produced for food, energy, and smithore-the only three goods produced on the planet Irata-in 2018 and 2019. Prices (in $) Quantities 2019 2019 2018 2018 31 27 18 food 20 34 35 15 14 energy smithore 48 54 12 Fill in the table below, calculating the total GDP for Irata for 2018 and 2019, in both 2018 prices and...
Real vs. Nominal Interest Rates. Suppose the nominal value of your savings increased from $5000 t...
 Real vs. Nominal Interest Rates. Suppose the nominal value of your savings increased from $5000 to $5350 between 2017 and 2018. 5. Calculate the annual nominal idterest rate that you earned on your savings. Suppose the CPl increased from 100 to 102 between 2017 and 2018. What is the growth rate of the real value of your savings? Suppose you had expected the inflation rate to be 1%. Compared to your expectation, are you better off or worse off a....
Consider the following data assuming that these are the only products produced and consumed in the...
Consider the following data assuming that these are the only products produced and consumed in the economy: Product 2017 Quantity 2017 Price ($) 2018 Quantity 2018 Price ($) Beer 14 18 16 13 Chocolate 15 11 17 12 Using 2018 as the base year answer the following questions: a. What was the nominal GDP in 2017 and 2018? b. What was the real GDP in 2017 and 2018? c. What was the GDP deflator in 2017 and 2018? d. What...
 According to the New Hampshire Department of Education, the average teacher salary in public school districts in New Hampshire was $45,166 in 2006, $46,670 in 2007, and $45,166 in 2008. Use the following information on CPI and PPI. Year CPI (1982 - 84 = 100) 201.59 164.80 207.34 PPI (1982 - 100) 2006 2007 2008 2009 215.30 214.54 172.70 189.60 172.90 Source: Bureau of Labor Statistics. a. Calculate the real salary for the teachers. (Round your answers to 2 decimal...
 The table below shows the GDP deflator and the CPI over the past five years. By what percentage did prices change between years for each measure? Instructions: Enter your answers as percentages rounded to two decimal places. Year Change in GDP deflator CPI GDP deflator 100 Change in CPI 2015 2016 105 100 104 110 113 2017 2018 2019 2015-2019 112 123 128 122
 According to the New Hampshire Department of Education, the average teacher salary in public school districts in New Hampshire was $47,035 in 2006, $48,482 in 2007, and $47,035 in 2008. Use the following information on CPI and PPI. 100) Year 2006 2007 2008 2009 CPI (1982 84 = 100) 201.59 207.34 215.30 214.54 PPI (1982 164.80 172.70 189.60 172.90 Source: Bureau of Labor Statistics. a. Calculate the real salary for the teachers. (Round your answers to 2 decimal places.) Year...
 According to the New Hampshire Department of Education, the average teacher salary in public school districts in New Hampshire was $47,650 in 2006, $49,151 in 2007, and $47,650 in 2008. Use the following information on CPI and PPI. Year 2006 2007 2008 2009 CPI (1982 – 84 = 100) 201.59 207.34 215.30 214.54 PPI (1982 = 100) 164.80 172.70 189.60 172.90 Source: Bureau of Labor Statistics. a. Calculate the real salary for the teachers. (Round your answers to 2 decimal...
 According to the New Hampshire Department of Education, the average teacher salary in public school districts in New Hampshire was $47,473 in 2006, $49,065 in 2007, and $47,473 in 2008. Use the following information on CPI and PPL. Year CPI (1982 - 84 100) PPI (1982 100) 2006 201.59 164.80 172.70 215.30 2009 207.34 2007 2008 214.54 189.60 172.90 Source: Bureau of Labor Statistics. a. Calculate the real salary for the teachers. (Round your answers to 2 decimal places.) Real...
 According to the New Hampshire Department of Education, the average teacher salary in public school districts in New Hampshi was $47,473 in 2006, $49,065 in 2007, and $47,473 in 2008. Use the following information on CPI and PPI. Year CPI (1982 - 84 - 100) 2006 201.59 2007 207.34 2008 215.30 2009 214.54 PPI (1982 - 100) 164.80 172.70 189.60 172.90 Source: Bureau of Labor Statistics. a. Calculate the real salary for the teachers. (Round your answers to 2 decimal...
 Problem Set 1 EC 202, Winter 2020 University of Oregon points total) Below is a schedule for the prices and quantities produced for food, energy, and smithore-the only three goods produced on the planet Irata-in 2018 and 2019. Prices (in $) Quantities 2019 2019 2018 2018 31 27 18 food 20 34 35 15 14 energy smithore 48 54 12 Fill in the table below, calculating the total GDP for Irata for 2018 and 2019, in both 2018 prices and...
 Real vs. Nominal Interest Rates. Suppose the nominal value of your savings increased from $5000 to $5350 between 2017 and 2018. 5. Calculate the annual nominal idterest rate that you earned on your savings. Suppose the CPl increased from 100 to 102 between 2017 and 2018. What is the growth rate of the real value of your savings? Suppose you had expected the inflation rate to be 1%. Compared to your expectation, are you better off or worse off a....
Most questions answered within 3 hours.
-
Where is the error in this code sequence?
String s1 = "Hello";
String s2 = "ello";...
asked 10 months ago -
Financial data for Joel de Paris, Inc., for last year
follow:
Joel de Paris, Inc.
Balance...
asked 10 months ago -
Consider this reaction:
Al2(SO4)3 (aq)+ BaCl3
(aq) Al2Cl6 (aq)- +
3BaSO4(s) . What is the...
asked 10 months ago -
Suppose that Savneet is considering increasing her
recent random sample from 20 car rentals to 40...
asked 10 months ago -
Trucks arrive at an unloading terminal at an average rate of 120
per hour.
Trucks arrive...
asked 10 months ago -
Why are methanol and ethanol completely soluble in water while
octanol is not very little soluble....
asked 10 months ago -
A facilities manager at a university reads in a research report
that the mean amount of...
asked 10 months ago -
When the CuSO4 is rehydrated by adding water to the anhydrous
compound, is this an endothermic...
asked 10 months ago -
A ray of sunlight is passing from diamond into crown glass; the
angle of incidence is...
asked 10 months ago -
A block of mass 0.249 kg is placed on top of a light, vertical
spring of...
asked 10 months ago -
how do the kidneys compensate in the presences of acidosis
a) trigger hyperventilate
b) reserve acid...
asked 10 months ago -
Question 501 pts
The rental rate of capital to the firm increases. Which of the
following...
asked 10 months ago