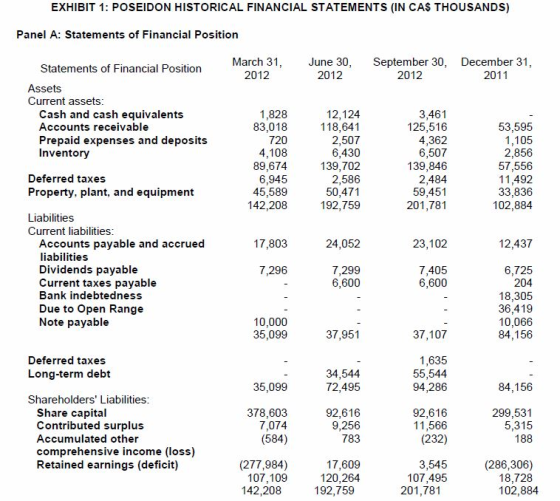
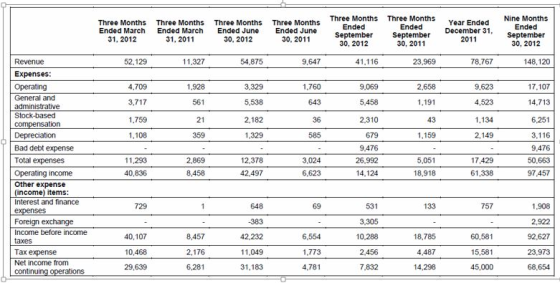
Calculate the average collection period. What does it indicate?
What red flags can be identified from the financial statements?
Homework Answers
| (Figures in $000) | ||||||
| March 31 2012 | June.30,2012 | Sep.30, 2012 | Dec.31, 2011 | |||
| A | Accounts Receivable | 83,018 | 118,641 | 125,516 | 53,595 | |
| B | Three Months Revenue | 52,129 | 54,875 | 41,116 | 78,767 | |
| C=(A/B)*90 | Collection Period in days | 143 | 195 | 275 | 61 | |
| Average Collection Period in days | 168.5 | (143+195+275+61)/4 | ||||
| It indicates that on an average it requires 168.5 days to collect the amount after sales | ||||||
| (NOTE: It is assumed that allsales are made on credit) | ||||||
| Red Flags: | ||||||
| Three months ended September 2012,show high expenses and low income | ||||||
| There is bad debt expense of 9476 in September 2012 | ||||||
Add Answer to:
Calculate the average collection period. What does it
indicate?
What red flags can be identified from...
Note the industry average ratios below: A/R days (based on average balances) = 57 days A/P days (based on average balances) = 23 days Current ratio (based on ending balance) = 1.8x Based on Acme’s A...
 Note the industry average ratios below:
A/R days (based on average balances) = 57 days
A/P days (based on average balances) = 23 days
Current ratio (based on ending balance) = 1.8x
Based on Acme’s A/R days, A/P days and Current ratios for the
nine months ending September 30, 2017, which of the following
conclusions is most accurate? Assume 273 days in the nine months
ending September 30, 2017 and 365 days in the year.
Compared to the industry average:...
Note the industry average ratios below:
A/R days (based on average balances) = 57 days
A/P days (based on average balances) = 23 days
Current ratio (based on ending balance) = 1.8x
Based on Acme’s A/R days, A/P days and Current ratios for the
nine months ending September 30, 2017, which of the following
conclusions is most accurate? Assume 273 days in the nine months
ending September 30, 2017 and 365 days in the year.
Compared to the industry average:...
Calculate Average Collection Period Ratio All Is Not Paradise in Eden's Garden: Part 1 $689,247 $395,683...
 Calculate Average Collection
Period Ratio
All Is Not Paradise in Eden's Garden: Part 1 $689,247 $395,683 $293,564 Joe and Kaitlin Eden, co-owners of Eden's Garden, a small nurs- ery, lawn, and garden supply business, have just received their Balance Sheet, Eden's Garden Assets Current Assets Cash $6,457 Accounts Receivable $29,152 Less Allowance for $3,200 $25,952 Doubtful Accounts Inventory $88,157 Supplies $7,514 Prepaid Expenses $1,856 Total Current Assets $129,936 Fixed Assets Land $59,150 Buildings $51,027 Less Accumulated Depreciation $2,061 548,966 Autos...
Calculate Average Collection
Period Ratio
All Is Not Paradise in Eden's Garden: Part 1 $689,247 $395,683 $293,564 Joe and Kaitlin Eden, co-owners of Eden's Garden, a small nurs- ery, lawn, and garden supply business, have just received their Balance Sheet, Eden's Garden Assets Current Assets Cash $6,457 Accounts Receivable $29,152 Less Allowance for $3,200 $25,952 Doubtful Accounts Inventory $88,157 Supplies $7,514 Prepaid Expenses $1,856 Total Current Assets $129,936 Fixed Assets Land $59,150 Buildings $51,027 Less Accumulated Depreciation $2,061 548,966 Autos...
Using financial ratio analysis, evaluate American Apparel’s financial performance for the past five years. Leverage Ratio...
 Using financial ratio analysis, evaluate American Apparel’s
financial performance for the past five years.
Leverage Ratio Analysis
Ratio of Total Liabilities-To-Total Assets
Ratio of Long-Term Liabilities-To-Equity
Ratio of Total Liabilities-To-Equity
Coverage Ratio Analysis
Interest Coverage Ratio
Liquidity and Solvency Ratio Analysis
Current Ratio
Quick Ratio
Efficiency Ratio Analysis
Working Capital Turnover
Inventory Turnover
Receivable Turnover
Profitability Ratio Analysis
Net Profit Margin Ratio
Gross Profit Ratio
Rate Earned on Equity
Rate Earned on Assets
Cash Performance
Operating Cash Return on Equity...
Using financial ratio analysis, evaluate American Apparel’s
financial performance for the past five years.
Leverage Ratio Analysis
Ratio of Total Liabilities-To-Total Assets
Ratio of Long-Term Liabilities-To-Equity
Ratio of Total Liabilities-To-Equity
Coverage Ratio Analysis
Interest Coverage Ratio
Liquidity and Solvency Ratio Analysis
Current Ratio
Quick Ratio
Efficiency Ratio Analysis
Working Capital Turnover
Inventory Turnover
Receivable Turnover
Profitability Ratio Analysis
Net Profit Margin Ratio
Gross Profit Ratio
Rate Earned on Equity
Rate Earned on Assets
Cash Performance
Operating Cash Return on Equity...
Directions: Click the Case Link above and use the information provided in Frazier & Sons Inc.,...
 Directions: Click the Case Link above
and use the information provided in Frazier & Sons Inc., Part
A, to answer this question:
What was Frazier & Sons' earnings before interest, taxes,
depreciation and amortization (EBITDA) for the year
20Y2?
This is a single choice question. Selections are automatically
selected as you use arrow to move.
a. $45,500
b. $52,800
c. $59,800
d. $67,100
Frazier & Sons, Inc. Part A Frazier & Sons, Inc. Balance Sheets Ast December 31 2012 2011...
Directions: Click the Case Link above
and use the information provided in Frazier & Sons Inc., Part
A, to answer this question:
What was Frazier & Sons' earnings before interest, taxes,
depreciation and amortization (EBITDA) for the year
20Y2?
This is a single choice question. Selections are automatically
selected as you use arrow to move.
a. $45,500
b. $52,800
c. $59,800
d. $67,100
Frazier & Sons, Inc. Part A Frazier & Sons, Inc. Balance Sheets Ast December 31 2012 2011...
EXHIBIT 3: AMERICAN APPAREL INC. AND SUBSIDIARIES CONSOLIDATED BALANCE SHEET, 2008–2013 December 31, (Amounts and shares...
 EXHIBIT 3: AMERICAN APPAREL INC. AND SUBSIDIARIES
CONSOLIDATED BALANCE SHEET, 2008–2013
December 31,
(Amounts and shares in thousands, except per share amounts)
2013
2012
2011
2010
2009
2008
ASSETS
CURRENT ASSETS
Cash
$ 8,676
$ 12,853
$ 10,293
$ 7,656
$ 9,046
$ 11,368
Trade accounts receivable
20,701
22,962
20,939
16,688
16,907
16,439
Restricted cash
-
3,733
Prepaid expenses and other current assets
15,636
9,589
7,631
9,401
9,994
5,369
Inventories, net
169,378
174,229
185,764
178,052
141,235
148,154
Income taxes receivable...
EXHIBIT 3: AMERICAN APPAREL INC. AND SUBSIDIARIES
CONSOLIDATED BALANCE SHEET, 2008–2013
December 31,
(Amounts and shares in thousands, except per share amounts)
2013
2012
2011
2010
2009
2008
ASSETS
CURRENT ASSETS
Cash
$ 8,676
$ 12,853
$ 10,293
$ 7,656
$ 9,046
$ 11,368
Trade accounts receivable
20,701
22,962
20,939
16,688
16,907
16,439
Restricted cash
-
3,733
Prepaid expenses and other current assets
15,636
9,589
7,631
9,401
9,994
5,369
Inventories, net
169,378
174,229
185,764
178,052
141,235
148,154
Income taxes receivable...
1. Calculate the Accounts Receivable Turnover for Apple for the most recent year, then describe how...
 1. Calculate the Accounts Receivable Turnover for Apple for the most recent year, then describe how you located the information and performed your calculation. 2. Calculate the Accounts Receivable Turnover for Microsoft for the most recent year, then describe how you located the information and performed your calculation. Microsoft 10-K June 30 2019.pdf (page 53 of 146) @ Q Search PARTII BALANCE SHEETS in milions) 2019 2018 June 30 Assets Current assets: Cash and cash equivalents Short-term investments 11,356 122.463...
1. Calculate the Asset Turnover for Apple for the most recent year, then describe how you...
 1. Calculate the Asset Turnover for Apple for the most recent year, then describe how you located the information and performed your calculation. 2. Calculate the Asset Turnover for Microsoft for the most recent year, then describe how you located the information and performed your calculation. Microsoft 10-K June 30 2019.pdf (page 53 of 146) Search PART Item 8 BALANCE SHEETS n milions) June 30, 2019 2018 Assets Current assets: S 11,356 11,946 122,463 Cash and cash equivalents Short-term investments...
Required: Prepare a master budget for the three-month period ending June 30. Include the following detailed...
 Required: Prepare a master budget for the three-month period ending June 30. Include the following detailed schedules: 1. a. A sales budget, by month and in total. b. A schedule of expected cash collections, by month and in total. c. A merchandise purchases budget in units and in dollars. Show the budget by month and in total. d. A schedule of expected cash disbursements for merchandise purchases, by month and in total. 2. A cash budget. Show the budget by...
Analysis IT Use a spreadsheet to construct common-size income statements (which Starbucks calls statements of eamings)...
 Analysis IT Use a spreadsheet to construct common-size income statements (which Starbucks calls statements of eamings) and balance sheets for 2013 and 2012. Common-size income statements scale cach income statement line item by total net revenues (sales). Common-size balance sheets are created by dividing! each figure on a given year's balance sheet by that year's total assets, thereby creating a balance sheet on a percent of assets" basis. You will use these common-size statements in answering several of the questions...
Production Budget Weightless Inc. produces a small and large version of its popular electronic scale. The...
 Production Budget Weightless Inc. produces a small and large version of its popular electronic scale. The anticipated unit sales for the scales by sales region are as follows: Bath Scale Gym Scale East Region unit sales 25,400 33,000 West Region unit sales 27,400 28,800 Total 52,800 61,800 The finished goods inventory estimated for October 1 for the Bath and Gym scale models is 1,600 and 2,000 units, respectively. The desired finished goods inventory for October 31 for the Bath and...
 Note the industry average ratios below:
A/R days (based on average balances) = 57 days
A/P days (based on average balances) = 23 days
Current ratio (based on ending balance) = 1.8x
Based on Acme’s A/R days, A/P days and Current ratios for the
nine months ending September 30, 2017, which of the following
conclusions is most accurate? Assume 273 days in the nine months
ending September 30, 2017 and 365 days in the year.
Compared to the industry average:...
Note the industry average ratios below:
A/R days (based on average balances) = 57 days
A/P days (based on average balances) = 23 days
Current ratio (based on ending balance) = 1.8x
Based on Acme’s A/R days, A/P days and Current ratios for the
nine months ending September 30, 2017, which of the following
conclusions is most accurate? Assume 273 days in the nine months
ending September 30, 2017 and 365 days in the year.
Compared to the industry average:...
 Calculate Average Collection
Period Ratio
All Is Not Paradise in Eden's Garden: Part 1 $689,247 $395,683 $293,564 Joe and Kaitlin Eden, co-owners of Eden's Garden, a small nurs- ery, lawn, and garden supply business, have just received their Balance Sheet, Eden's Garden Assets Current Assets Cash $6,457 Accounts Receivable $29,152 Less Allowance for $3,200 $25,952 Doubtful Accounts Inventory $88,157 Supplies $7,514 Prepaid Expenses $1,856 Total Current Assets $129,936 Fixed Assets Land $59,150 Buildings $51,027 Less Accumulated Depreciation $2,061 548,966 Autos...
Calculate Average Collection
Period Ratio
All Is Not Paradise in Eden's Garden: Part 1 $689,247 $395,683 $293,564 Joe and Kaitlin Eden, co-owners of Eden's Garden, a small nurs- ery, lawn, and garden supply business, have just received their Balance Sheet, Eden's Garden Assets Current Assets Cash $6,457 Accounts Receivable $29,152 Less Allowance for $3,200 $25,952 Doubtful Accounts Inventory $88,157 Supplies $7,514 Prepaid Expenses $1,856 Total Current Assets $129,936 Fixed Assets Land $59,150 Buildings $51,027 Less Accumulated Depreciation $2,061 548,966 Autos...
 Using financial ratio analysis, evaluate American Apparel’s
financial performance for the past five years.
Leverage Ratio Analysis
Ratio of Total Liabilities-To-Total Assets
Ratio of Long-Term Liabilities-To-Equity
Ratio of Total Liabilities-To-Equity
Coverage Ratio Analysis
Interest Coverage Ratio
Liquidity and Solvency Ratio Analysis
Current Ratio
Quick Ratio
Efficiency Ratio Analysis
Working Capital Turnover
Inventory Turnover
Receivable Turnover
Profitability Ratio Analysis
Net Profit Margin Ratio
Gross Profit Ratio
Rate Earned on Equity
Rate Earned on Assets
Cash Performance
Operating Cash Return on Equity...
Using financial ratio analysis, evaluate American Apparel’s
financial performance for the past five years.
Leverage Ratio Analysis
Ratio of Total Liabilities-To-Total Assets
Ratio of Long-Term Liabilities-To-Equity
Ratio of Total Liabilities-To-Equity
Coverage Ratio Analysis
Interest Coverage Ratio
Liquidity and Solvency Ratio Analysis
Current Ratio
Quick Ratio
Efficiency Ratio Analysis
Working Capital Turnover
Inventory Turnover
Receivable Turnover
Profitability Ratio Analysis
Net Profit Margin Ratio
Gross Profit Ratio
Rate Earned on Equity
Rate Earned on Assets
Cash Performance
Operating Cash Return on Equity...
 Directions: Click the Case Link above
and use the information provided in Frazier & Sons Inc., Part
A, to answer this question:
What was Frazier & Sons' earnings before interest, taxes,
depreciation and amortization (EBITDA) for the year
20Y2?
This is a single choice question. Selections are automatically
selected as you use arrow to move.
a. $45,500
b. $52,800
c. $59,800
d. $67,100
Frazier & Sons, Inc. Part A Frazier & Sons, Inc. Balance Sheets Ast December 31 2012 2011...
Directions: Click the Case Link above
and use the information provided in Frazier & Sons Inc., Part
A, to answer this question:
What was Frazier & Sons' earnings before interest, taxes,
depreciation and amortization (EBITDA) for the year
20Y2?
This is a single choice question. Selections are automatically
selected as you use arrow to move.
a. $45,500
b. $52,800
c. $59,800
d. $67,100
Frazier & Sons, Inc. Part A Frazier & Sons, Inc. Balance Sheets Ast December 31 2012 2011...
 EXHIBIT 3: AMERICAN APPAREL INC. AND SUBSIDIARIES
CONSOLIDATED BALANCE SHEET, 2008–2013
December 31,
(Amounts and shares in thousands, except per share amounts)
2013
2012
2011
2010
2009
2008
ASSETS
CURRENT ASSETS
Cash
$ 8,676
$ 12,853
$ 10,293
$ 7,656
$ 9,046
$ 11,368
Trade accounts receivable
20,701
22,962
20,939
16,688
16,907
16,439
Restricted cash
-
3,733
Prepaid expenses and other current assets
15,636
9,589
7,631
9,401
9,994
5,369
Inventories, net
169,378
174,229
185,764
178,052
141,235
148,154
Income taxes receivable...
EXHIBIT 3: AMERICAN APPAREL INC. AND SUBSIDIARIES
CONSOLIDATED BALANCE SHEET, 2008–2013
December 31,
(Amounts and shares in thousands, except per share amounts)
2013
2012
2011
2010
2009
2008
ASSETS
CURRENT ASSETS
Cash
$ 8,676
$ 12,853
$ 10,293
$ 7,656
$ 9,046
$ 11,368
Trade accounts receivable
20,701
22,962
20,939
16,688
16,907
16,439
Restricted cash
-
3,733
Prepaid expenses and other current assets
15,636
9,589
7,631
9,401
9,994
5,369
Inventories, net
169,378
174,229
185,764
178,052
141,235
148,154
Income taxes receivable...
 1. Calculate the Accounts Receivable Turnover for Apple for the most recent year, then describe how you located the information and performed your calculation. 2. Calculate the Accounts Receivable Turnover for Microsoft for the most recent year, then describe how you located the information and performed your calculation. Microsoft 10-K June 30 2019.pdf (page 53 of 146) @ Q Search PARTII BALANCE SHEETS in milions) 2019 2018 June 30 Assets Current assets: Cash and cash equivalents Short-term investments 11,356 122.463...
 1. Calculate the Asset Turnover for Apple for the most recent year, then describe how you located the information and performed your calculation. 2. Calculate the Asset Turnover for Microsoft for the most recent year, then describe how you located the information and performed your calculation. Microsoft 10-K June 30 2019.pdf (page 53 of 146) Search PART Item 8 BALANCE SHEETS n milions) June 30, 2019 2018 Assets Current assets: S 11,356 11,946 122,463 Cash and cash equivalents Short-term investments...
 Required: Prepare a master budget for the three-month period ending June 30. Include the following detailed schedules: 1. a. A sales budget, by month and in total. b. A schedule of expected cash collections, by month and in total. c. A merchandise purchases budget in units and in dollars. Show the budget by month and in total. d. A schedule of expected cash disbursements for merchandise purchases, by month and in total. 2. A cash budget. Show the budget by...
 Analysis IT Use a spreadsheet to construct common-size income statements (which Starbucks calls statements of eamings) and balance sheets for 2013 and 2012. Common-size income statements scale cach income statement line item by total net revenues (sales). Common-size balance sheets are created by dividing! each figure on a given year's balance sheet by that year's total assets, thereby creating a balance sheet on a percent of assets" basis. You will use these common-size statements in answering several of the questions...
 Production Budget Weightless Inc. produces a small and large version of its popular electronic scale. The anticipated unit sales for the scales by sales region are as follows: Bath Scale Gym Scale East Region unit sales 25,400 33,000 West Region unit sales 27,400 28,800 Total 52,800 61,800 The finished goods inventory estimated for October 1 for the Bath and Gym scale models is 1,600 and 2,000 units, respectively. The desired finished goods inventory for October 31 for the Bath and...
Most questions answered within 3 hours.
-
Where is the error in this code sequence?
String s1 = "Hello";
String s2 = "ello";...
asked 10 months ago -
Financial data for Joel de Paris, Inc., for last year
follow:
Joel de Paris, Inc.
Balance...
asked 10 months ago -
Consider this reaction:
Al2(SO4)3 (aq)+ BaCl3
(aq) Al2Cl6 (aq)- +
3BaSO4(s) . What is the...
asked 10 months ago -
Suppose that Savneet is considering increasing her
recent random sample from 20 car rentals to 40...
asked 10 months ago -
Trucks arrive at an unloading terminal at an average rate of 120
per hour.
Trucks arrive...
asked 10 months ago -
Why are methanol and ethanol completely soluble in water while
octanol is not very little soluble....
asked 10 months ago -
A facilities manager at a university reads in a research report
that the mean amount of...
asked 10 months ago -
When the CuSO4 is rehydrated by adding water to the anhydrous
compound, is this an endothermic...
asked 10 months ago -
A ray of sunlight is passing from diamond into crown glass; the
angle of incidence is...
asked 10 months ago -
A block of mass 0.249 kg is placed on top of a light, vertical
spring of...
asked 10 months ago -
how do the kidneys compensate in the presences of acidosis
a) trigger hyperventilate
b) reserve acid...
asked 10 months ago -
Question 501 pts
The rental rate of capital to the firm increases. Which of the
following...
asked 10 months ago