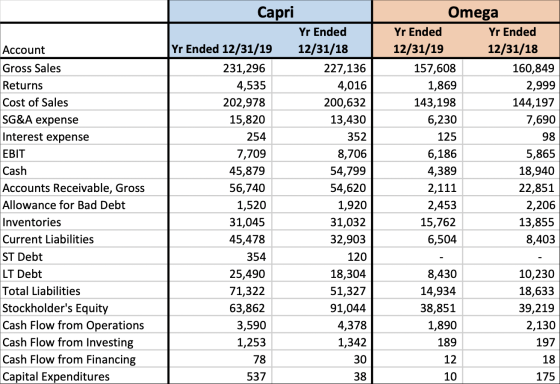
Using the information below, calculate the following ratios for both companies for 2019 and compare/contrast EACH ratio.
- DSO
- Quick Ratio
- Times Interest Earned
- Total Liabilities-to-Equity
- Free Operating cash flow to total debt
- Current Ratio
- Total debt to equity
- Accounts receivable turnover
Homework Answers

Add Answer to:
Using the information below, calculate the following ratios for
both companies for 2019 and
compare/contrast EACH...
Using the information below, calculate the following ratios for both companies for 2019and compare/contrastEACHratio. a. DSO...
 Using the information below, calculate the following ratios for
both companies for 2019and
compare/contrastEACHratio.
a. DSO
b. Quick Ratio
c. Times Interest Earned
d. Total Liabilities-to-Equity
e. Free Operating cash flow to total
debt
f. Current Ratio
g. Total debt to equity
h. Accounts receivable turnover
Account Gross Sales Returns Cost of Sales SG&A expense Interest expense EBIT Cash Accounts Receivable, Gross Allowance for Bad Debt Inventories Current Liabilities ST Debt LT Debt Total Liabilities Stockholder's Equity Cash Flow from...
Using the information below, calculate the following ratios for
both companies for 2019and
compare/contrastEACHratio.
a. DSO
b. Quick Ratio
c. Times Interest Earned
d. Total Liabilities-to-Equity
e. Free Operating cash flow to total
debt
f. Current Ratio
g. Total debt to equity
h. Accounts receivable turnover
Account Gross Sales Returns Cost of Sales SG&A expense Interest expense EBIT Cash Accounts Receivable, Gross Allowance for Bad Debt Inventories Current Liabilities ST Debt LT Debt Total Liabilities Stockholder's Equity Cash Flow from...
AutoSave OFF Aos 50 w Homework #2 - Saved to my Mac Home Share Comments Insert...
 AutoSave OFF Aos 50 w Homework #2 - Saved to my Mac Home Share Comments Insert Draw Design Layout References Mailings Review View Arial 10A A Aa A EvEv * BI U vab x, xALA EEEE Ev AaBbCcDdE List Paragraph AaBbCcDdE Normal AaBbCcDdE AaBbCcDc AaBbCcDdEt AaBb(AaBb CcDdEt No Spacing Heading 1 Heading 2 Title Subtitle Paste v Styles Sensitivity Panel Using the information below, calculate the following ratios for both companies for 2019 and compare/contrast EACH ratio. a. DSO b....
Using the following information: Calculate the following ratios for Urban Outfitters for both 2016 and 2017...
 Using the following information:
Calculate the following ratios for Urban Outfitters for
both 2016 and
2017 (show calculations):
a. Gross profit margin
b. Operating profit margin
c. Net profit margin
d. Times interest earned coverage
e. Return on shareholders’ equity
f. Return on assets
g. Debt-to-equity ratio
h. Days of inventory
i. Inventory turnover ratio
j. Average collection period
Consolidated Income Statements for Urban ters, Inc. 2016 2017 $3.545.794 $3,445,134 Net sales (total revenue) 2,301,181 2,243,232 Cost of sales 906,086...
Using the following information:
Calculate the following ratios for Urban Outfitters for
both 2016 and
2017 (show calculations):
a. Gross profit margin
b. Operating profit margin
c. Net profit margin
d. Times interest earned coverage
e. Return on shareholders’ equity
f. Return on assets
g. Debt-to-equity ratio
h. Days of inventory
i. Inventory turnover ratio
j. Average collection period
Consolidated Income Statements for Urban ters, Inc. 2016 2017 $3.545.794 $3,445,134 Net sales (total revenue) 2,301,181 2,243,232 Cost of sales 906,086...
Required information [The following information applies to the questions displayed below.] Simon Company’s year-end balance sheets...
Required information [The following information applies to the questions displayed below.] Simon Company’s year-end balance sheets follow. At December 31 Current Yr 1 Yr Ago 2 Yrs Ago Assets Cash $ 36,426 $ 41,743 $ 43,048 Accounts receivable, net 101,432 73,781 55,709 Merchandise inventory 132,737 94,601 59,324 Prepaid expenses 11,615 10,958 4,736 Plant assets, net 323,068 300,708 263,483 Total assets $ 605,278 $ 521,791 $ 426,300 Liabilities and Equity Accounts payable $ 153,729 $ 88,183 $ 57,960 Long-term notes payable...
Ratios Analyzing Long-Term Firm Solvency The following information is available for Banner Company: Annual Data 2019...
Ratios Analyzing Long-Term Firm Solvency The following information is available for Banner Company: Annual Data 2019 2018 Interest expense $85,000 $82,000 Income tax expense 203,500 185,000 Net income 496,500 425,000 Capital expenditures 320,000 380,000 Cash provided by operating activities 450,000 390,000 Year-End Data Dec. 31, 2019 Dec. 31, 2018 Total liabilities $2,400,000 $1,900,000 Total stockholders’ equity 4,200,000 3,800,000 Calculate the following: Note: Round all answers to two decimal places. a. 2019 debt-to-equity ratio. b. 2019 times-interest-earned ratio. c. 2019 operating-cash-flow-to-capital-expenditures...
Required information (The following information applies to the questions displayed below.) Marshall Company has been in...
 Required information (The following information applies to the questions displayed below.) Marshall Company has been in business for several years now. Marshall Company's year-end balance sheets follow. Current Yr 1 Yr Ago 2 Yrs Ago At December 31 Assets Cash Accounts receivable, net Merchandise inventory Prepaid expenses Plant assets, net Total assets Liabilities and Equity Accounts payable Long-term notes payable secured by mortgages on plant assets Conmon stock, $10 par value Retained earnings Total liabilities and equity $ 35,381 103,592...
Ratios Analyzing Long-Term Firm Solvency The following information is available for Banner Company: Annual Data 2019...
 Ratios Analyzing Long-Term Firm Solvency The following information is available for Banner Company: Annual Data 2019 2018 Interest expense $85,000 $82,000 203,500 185,000 Income tax expense Net income 496,500 425,000 Capital expenditures 320,000 380,000 Cash provided by operating activities 450,000 390,000 Year-End Data Dec. 31, 2019 Dec. 31, 2018 Total liabilities $2,400,000 $1,900,000 Total stockholders equity 4,200,000 3,800,000 Calculate the following: Note: Round all answers to two decimal places. a. 2019 debt-to-equity ratio. b. 2019 times-interest-earned ratio. 0 c. 2019...
Required information [The following information applies to the questions displayed below.) Simon Company's year-end balance sheets...
 Required information [The following information applies to the questions displayed below.) Simon Company's year-end balance sheets follow. Current Yr 1 Yr Ago 2 Yrs Ago At December 31 Assets Cash Accounts receivable, net Merchandise inventory Prepaid expenses Plant assets, net Total assets Liabilities and Equity Accounts payable Long-term notes payable secured by mortgages on plant assets Common stock, $10 par value Retained earnings Total liabilities and equity $ 26,752 81,533 103,517 8,615 247,036 $467,453 $ 31,593 $ 33,588 57,545 45,241...
Calculate the following ratios based on Wendy's 2017 and 2018 financial statements and comment on the...
 Calculate the following ratios based on Wendy's 2017 and 2018
financial statements and comment on the differences between FY 2017
and FY 2018.
Wendy's
FY 2017
FY 2018
Liquidity
Current Ratio:
Quick Ratio:
Comments on the companies' liquidity - what do the numbers
say?
Asset Management
Total Asset Turnover:
Avg Collection Period:
Comments on the companies' asset management - what do the numbers
say?
Debt Management
Total Debt to Total Assets:
Times Interest Earned:
Comments on the companies' debt management...
Calculate the following ratios based on Wendy's 2017 and 2018
financial statements and comment on the differences between FY 2017
and FY 2018.
Wendy's
FY 2017
FY 2018
Liquidity
Current Ratio:
Quick Ratio:
Comments on the companies' liquidity - what do the numbers
say?
Asset Management
Total Asset Turnover:
Avg Collection Period:
Comments on the companies' asset management - what do the numbers
say?
Debt Management
Total Debt to Total Assets:
Times Interest Earned:
Comments on the companies' debt management...
Compute and Interpret Liquidity, Solvency and Coverage Ratios Information from the balance sheet, income statement, and...
 Compute and Interpret Liquidity, Solvency and Coverage Ratios Information from the balance sheet, income statement, and statement of cash flows for Nike follows. Refer to these financial statements to answer the requirements. NIKE, INC. Consolidated Statements of Income Year Ended December 31 (In millions) 2019 2018 Revenues $39,117 $36,397 Cost of sales 21,643 20,441 Gross profit 17,474 15,956 Demand creation expense 3,753 3,577 Operating overhead expense 8,949 7,934 Total selling and administrative expense 12,702 11,511 Interest expense (income), net 49...
 Using the information below, calculate the following ratios for
both companies for 2019and
compare/contrastEACHratio.
a. DSO
b. Quick Ratio
c. Times Interest Earned
d. Total Liabilities-to-Equity
e. Free Operating cash flow to total
debt
f. Current Ratio
g. Total debt to equity
h. Accounts receivable turnover
Account Gross Sales Returns Cost of Sales SG&A expense Interest expense EBIT Cash Accounts Receivable, Gross Allowance for Bad Debt Inventories Current Liabilities ST Debt LT Debt Total Liabilities Stockholder's Equity Cash Flow from...
Using the information below, calculate the following ratios for
both companies for 2019and
compare/contrastEACHratio.
a. DSO
b. Quick Ratio
c. Times Interest Earned
d. Total Liabilities-to-Equity
e. Free Operating cash flow to total
debt
f. Current Ratio
g. Total debt to equity
h. Accounts receivable turnover
Account Gross Sales Returns Cost of Sales SG&A expense Interest expense EBIT Cash Accounts Receivable, Gross Allowance for Bad Debt Inventories Current Liabilities ST Debt LT Debt Total Liabilities Stockholder's Equity Cash Flow from...
 AutoSave OFF Aos 50 w Homework #2 - Saved to my Mac Home Share Comments Insert Draw Design Layout References Mailings Review View Arial 10A A Aa A EvEv * BI U vab x, xALA EEEE Ev AaBbCcDdE List Paragraph AaBbCcDdE Normal AaBbCcDdE AaBbCcDc AaBbCcDdEt AaBb(AaBb CcDdEt No Spacing Heading 1 Heading 2 Title Subtitle Paste v Styles Sensitivity Panel Using the information below, calculate the following ratios for both companies for 2019 and compare/contrast EACH ratio. a. DSO b....
 Using the following information:
Calculate the following ratios for Urban Outfitters for
both 2016 and
2017 (show calculations):
a. Gross profit margin
b. Operating profit margin
c. Net profit margin
d. Times interest earned coverage
e. Return on shareholders’ equity
f. Return on assets
g. Debt-to-equity ratio
h. Days of inventory
i. Inventory turnover ratio
j. Average collection period
Consolidated Income Statements for Urban ters, Inc. 2016 2017 $3.545.794 $3,445,134 Net sales (total revenue) 2,301,181 2,243,232 Cost of sales 906,086...
Using the following information:
Calculate the following ratios for Urban Outfitters for
both 2016 and
2017 (show calculations):
a. Gross profit margin
b. Operating profit margin
c. Net profit margin
d. Times interest earned coverage
e. Return on shareholders’ equity
f. Return on assets
g. Debt-to-equity ratio
h. Days of inventory
i. Inventory turnover ratio
j. Average collection period
Consolidated Income Statements for Urban ters, Inc. 2016 2017 $3.545.794 $3,445,134 Net sales (total revenue) 2,301,181 2,243,232 Cost of sales 906,086...
 Required information (The following information applies to the questions displayed below.) Marshall Company has been in business for several years now. Marshall Company's year-end balance sheets follow. Current Yr 1 Yr Ago 2 Yrs Ago At December 31 Assets Cash Accounts receivable, net Merchandise inventory Prepaid expenses Plant assets, net Total assets Liabilities and Equity Accounts payable Long-term notes payable secured by mortgages on plant assets Conmon stock, $10 par value Retained earnings Total liabilities and equity $ 35,381 103,592...
 Ratios Analyzing Long-Term Firm Solvency The following information is available for Banner Company: Annual Data 2019 2018 Interest expense $85,000 $82,000 203,500 185,000 Income tax expense Net income 496,500 425,000 Capital expenditures 320,000 380,000 Cash provided by operating activities 450,000 390,000 Year-End Data Dec. 31, 2019 Dec. 31, 2018 Total liabilities $2,400,000 $1,900,000 Total stockholders equity 4,200,000 3,800,000 Calculate the following: Note: Round all answers to two decimal places. a. 2019 debt-to-equity ratio. b. 2019 times-interest-earned ratio. 0 c. 2019...
 Required information [The following information applies to the questions displayed below.) Simon Company's year-end balance sheets follow. Current Yr 1 Yr Ago 2 Yrs Ago At December 31 Assets Cash Accounts receivable, net Merchandise inventory Prepaid expenses Plant assets, net Total assets Liabilities and Equity Accounts payable Long-term notes payable secured by mortgages on plant assets Common stock, $10 par value Retained earnings Total liabilities and equity $ 26,752 81,533 103,517 8,615 247,036 $467,453 $ 31,593 $ 33,588 57,545 45,241...
 Calculate the following ratios based on Wendy's 2017 and 2018
financial statements and comment on the differences between FY 2017
and FY 2018.
Wendy's
FY 2017
FY 2018
Liquidity
Current Ratio:
Quick Ratio:
Comments on the companies' liquidity - what do the numbers
say?
Asset Management
Total Asset Turnover:
Avg Collection Period:
Comments on the companies' asset management - what do the numbers
say?
Debt Management
Total Debt to Total Assets:
Times Interest Earned:
Comments on the companies' debt management...
Calculate the following ratios based on Wendy's 2017 and 2018
financial statements and comment on the differences between FY 2017
and FY 2018.
Wendy's
FY 2017
FY 2018
Liquidity
Current Ratio:
Quick Ratio:
Comments on the companies' liquidity - what do the numbers
say?
Asset Management
Total Asset Turnover:
Avg Collection Period:
Comments on the companies' asset management - what do the numbers
say?
Debt Management
Total Debt to Total Assets:
Times Interest Earned:
Comments on the companies' debt management...
 Compute and Interpret Liquidity, Solvency and Coverage Ratios Information from the balance sheet, income statement, and statement of cash flows for Nike follows. Refer to these financial statements to answer the requirements. NIKE, INC. Consolidated Statements of Income Year Ended December 31 (In millions) 2019 2018 Revenues $39,117 $36,397 Cost of sales 21,643 20,441 Gross profit 17,474 15,956 Demand creation expense 3,753 3,577 Operating overhead expense 8,949 7,934 Total selling and administrative expense 12,702 11,511 Interest expense (income), net 49...
Most questions answered within 3 hours.
-
Where is the error in this code sequence?
String s1 = "Hello";
String s2 = "ello";...
asked 1 year ago -
Financial data for Joel de Paris, Inc., for last year
follow:
Joel de Paris, Inc.
Balance...
asked 1 year ago -
Consider this reaction:
Al2(SO4)3 (aq)+ BaCl3
(aq) Al2Cl6 (aq)- +
3BaSO4(s) . What is the...
asked 1 year ago -
Suppose that Savneet is considering increasing her
recent random sample from 20 car rentals to 40...
asked 1 year ago -
Trucks arrive at an unloading terminal at an average rate of 120
per hour.
Trucks arrive...
asked 1 year ago -
Why are methanol and ethanol completely soluble in water while
octanol is not very little soluble....
asked 1 year ago -
A facilities manager at a university reads in a research report
that the mean amount of...
asked 1 year ago -
When the CuSO4 is rehydrated by adding water to the anhydrous
compound, is this an endothermic...
asked 1 year ago -
A ray of sunlight is passing from diamond into crown glass; the
angle of incidence is...
asked 1 year ago -
A block of mass 0.249 kg is placed on top of a light, vertical
spring of...
asked 1 year ago -
how do the kidneys compensate in the presences of acidosis
a) trigger hyperventilate
b) reserve acid...
asked 1 year ago -
Question 501 pts
The rental rate of capital to the firm increases. Which of the
following...
asked 1 year ago