

Homework Answers
Add Answer to:
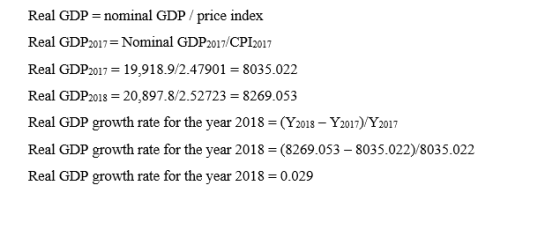
4) Calculating Real GDP Growth: Using the years 2017 and 2018 compute the real GDP growth...
7) Using the CPI data from above, calculate the Inflation Rate for the year 2011, using...
 7) Using the CPI data from above, calculate the Inflation Rate for the year 2011, using the data for 2010 and 2011 where P CPI: Inflation Rate = -1 Year Nominal GDP GDP chain index (2012 = 100) Population CPI (1982- 84 1000 211445 2007 1465 billion 2008 15145595 hillon 2009 5 14,623 billion 2010 S1140 billion 2011 S 15.796.5 Billion 20129 Non 2013 S ON. I on 2014 IS19 Non 2015 ISO on 2016 S hillon 2017 19 ORO...
Real GDP = Nominal GDP GDP Chain Index (Prices)*100 Population Year Nominal GDP GDP chain index...
 Real GDP = Nominal GDP GDP Chain Index (Prices)*100 Population Year Nominal GDP GDP chain index CPI (2012-100) (1982- 84=100) 2007 S 14,681.5 billion 93.150 211.445 2008 S 14,559.5 billion 94.896 211.398 2009 $ 14,628.0 billion 95.269 217.347 2010 $ 15,240.8 billion 96.781 220.472 2011 $ 15,796.5 billion 98.676 227.223 2012 $ 16,358.9 billion 100.728 231.221 2013 $ 17,083.1 billion 102.551 234.719 2014 $ 17,849.9 billion 104.078 236.252 2015 $ 18,350.8 billion 104.997 237.817 2016 $ 18,991.9 billion 106.543 242.772...
Australia's real GDP was SA1,730 billion in 2017 and SA1,782 billion in 2018
MacroeconomicAustralia's real GDP was SA1,730 billion in 2017 and SA1,782 billion in 2018. Australia's population was 24.6 million in 2017 and 25.0 million in 2018. Calculate a. The growth rate of real GDP b. The growth rate of real GDP per person. c. The approximate number of years it will take for real GDP per person in Australia to double if the current real GDP growth rate and population growth rate are maintained.
Using the following data, graph the real GDP growth rates for 2007–2016. Instructions: Use the tool...
 Using the following data, graph the real GDP growth rates for
2007–2016.
Instructions: Use the tool provided 'Growth' to
plot the line point by point (plot 10 points total). When plotting
each point, round the GDP growth rate to the nearest 0.25% (e.g.,
round 1.8% to 1.75%, round 2.4% to 2.5%, etc., refer to the fourth
column in the table).
Year Real GDP in Billions) Percent Change from Prior Year 1.80 Percent Change from Prior Year to be graphed 1.75...
Using the following data, graph the real GDP growth rates for
2007–2016.
Instructions: Use the tool provided 'Growth' to
plot the line point by point (plot 10 points total). When plotting
each point, round the GDP growth rate to the nearest 0.25% (e.g.,
round 1.8% to 1.75%, round 2.4% to 2.5%, etc., refer to the fourth
column in the table).
Year Real GDP in Billions) Percent Change from Prior Year 1.80 Percent Change from Prior Year to be graphed 1.75...
Recall the method of calculating real GDP detailed in the chapter. As you may already have...
 Recall the method of calculating real GDP detailed in the chapter. As you may already have noticed, this method has a problem: in calculating aggregate output, this method weights the output of the various goods and services by their relative prices in the base year. Say, for example, a textbook costs $100 in the base year, and a laptop costs $2,000. This means that the laptop would have 20 times the weight of a book in calculating aggregate output. But...
Suppose that real GDP for 2017 was $10,000 billion and real GDP for 2018 was $11,000...
Suppose that real GDP for 2017 was $10,000 billion and real GDP for 2018 was $11,000 billion. What is the rate of growth of real GDP between 2017 and 2018? Group of answer choices 1% 2% 5% 10%
Recall the method of calculating real GDP detailed in the chapter. As you may already have noticed, this method has a problem: in calculating aggregate output, this method weights the output of the various goods and services by their relative prices in
Recall the method of calculating real GDP detailed in the chapter. As you may already have noticed, this method has a problem: in calculating aggregate output, this method weights the output of the various goods and services by their relative prices in the base year. Say, for example, a textbook costs $100 in the base year, and a laptop costs $2,000. This means that the laptop would have 20 times the weight of a book in calculating aggregate output. But what happens when relative prices change? As you know,...
The graph shows New Zealand’s quarterly real GDP growth rate. Describe the pattern of economic growth...
 The graph shows New Zealand’s quarterly real GDP growth
rate.
Describe the pattern of economic growth in New Zealand, using
your economic vocabulary.
What do you think caused the pattern of growth in
2008/2009?
NEW ZEALAND GDP GROWTH RATE Percent Change in Gross Domestic Product 1.51.3 1.5 0.9 0.9 0.8 0.809 0.6 0.5 0.5 0.5 0.2 0.1 0.2 0.1 0.2 0.5 0.5 2007 2008 2009 2010 2011 SOURCE: www.TRADINGECONOMICS.COM İ STATISTICS NEW ZEALAND
The graph shows New Zealand’s quarterly real GDP growth
rate.
Describe the pattern of economic growth in New Zealand, using
your economic vocabulary.
What do you think caused the pattern of growth in
2008/2009?
NEW ZEALAND GDP GROWTH RATE Percent Change in Gross Domestic Product 1.51.3 1.5 0.9 0.9 0.8 0.809 0.6 0.5 0.5 0.5 0.2 0.1 0.2 0.1 0.2 0.5 0.5 2007 2008 2009 2010 2011 SOURCE: www.TRADINGECONOMICS.COM İ STATISTICS NEW ZEALAND
GDP in the United States was $16,150 billion in 2012, and $19,400 billion in 2017. Over...
GDP in the United States was $16,150 billion in 2012, and $19,400 billion in 2017. Over that same five years, population rose from 314 million people to 326 million, and prices rose by a total of 7.8%. The average annual rate of real per-capita growth from 2012-2017 was: a) 1.0% b) 1.4% c) 1.5% d) 2.1% e) 7.3%
Instructions: Enter your responses rounded to the nearest billion. a. Calculate real GDP for 2016 using...
 Instructions: Enter your
responses rounded to the nearest billion.
a. Calculate real GDP for 2016 using 2000 prices.
$ billion
b. By how much did real GDP increase between 2000 and 2016?
$ billion
c. By how much did nominal GDP increase between 2000 and
2016?
$ billion
Refer to the data below (all values are in billions): Year Nominal GDP GDP Deflator (in Billions of Dollars) (Price Index 2009 100) 2000 2001 2002 2003 2004 2005 2006 2007 2008 2009...
Instructions: Enter your
responses rounded to the nearest billion.
a. Calculate real GDP for 2016 using 2000 prices.
$ billion
b. By how much did real GDP increase between 2000 and 2016?
$ billion
c. By how much did nominal GDP increase between 2000 and
2016?
$ billion
Refer to the data below (all values are in billions): Year Nominal GDP GDP Deflator (in Billions of Dollars) (Price Index 2009 100) 2000 2001 2002 2003 2004 2005 2006 2007 2008 2009...
 7) Using the CPI data from above, calculate the Inflation Rate for the year 2011, using the data for 2010 and 2011 where P CPI: Inflation Rate = -1 Year Nominal GDP GDP chain index (2012 = 100) Population CPI (1982- 84 1000 211445 2007 1465 billion 2008 15145595 hillon 2009 5 14,623 billion 2010 S1140 billion 2011 S 15.796.5 Billion 20129 Non 2013 S ON. I on 2014 IS19 Non 2015 ISO on 2016 S hillon 2017 19 ORO...
 Real GDP = Nominal GDP GDP Chain Index (Prices)*100 Population Year Nominal GDP GDP chain index CPI (2012-100) (1982- 84=100) 2007 S 14,681.5 billion 93.150 211.445 2008 S 14,559.5 billion 94.896 211.398 2009 $ 14,628.0 billion 95.269 217.347 2010 $ 15,240.8 billion 96.781 220.472 2011 $ 15,796.5 billion 98.676 227.223 2012 $ 16,358.9 billion 100.728 231.221 2013 $ 17,083.1 billion 102.551 234.719 2014 $ 17,849.9 billion 104.078 236.252 2015 $ 18,350.8 billion 104.997 237.817 2016 $ 18,991.9 billion 106.543 242.772...
 Using the following data, graph the real GDP growth rates for
2007–2016.
Instructions: Use the tool provided 'Growth' to
plot the line point by point (plot 10 points total). When plotting
each point, round the GDP growth rate to the nearest 0.25% (e.g.,
round 1.8% to 1.75%, round 2.4% to 2.5%, etc., refer to the fourth
column in the table).
Year Real GDP in Billions) Percent Change from Prior Year 1.80 Percent Change from Prior Year to be graphed 1.75...
Using the following data, graph the real GDP growth rates for
2007–2016.
Instructions: Use the tool provided 'Growth' to
plot the line point by point (plot 10 points total). When plotting
each point, round the GDP growth rate to the nearest 0.25% (e.g.,
round 1.8% to 1.75%, round 2.4% to 2.5%, etc., refer to the fourth
column in the table).
Year Real GDP in Billions) Percent Change from Prior Year 1.80 Percent Change from Prior Year to be graphed 1.75...
 Recall the method of calculating real GDP detailed in the chapter. As you may already have noticed, this method has a problem: in calculating aggregate output, this method weights the output of the various goods and services by their relative prices in the base year. Say, for example, a textbook costs $100 in the base year, and a laptop costs $2,000. This means that the laptop would have 20 times the weight of a book in calculating aggregate output. But...
 The graph shows New Zealand’s quarterly real GDP growth
rate.
Describe the pattern of economic growth in New Zealand, using
your economic vocabulary.
What do you think caused the pattern of growth in
2008/2009?
NEW ZEALAND GDP GROWTH RATE Percent Change in Gross Domestic Product 1.51.3 1.5 0.9 0.9 0.8 0.809 0.6 0.5 0.5 0.5 0.2 0.1 0.2 0.1 0.2 0.5 0.5 2007 2008 2009 2010 2011 SOURCE: www.TRADINGECONOMICS.COM İ STATISTICS NEW ZEALAND
The graph shows New Zealand’s quarterly real GDP growth
rate.
Describe the pattern of economic growth in New Zealand, using
your economic vocabulary.
What do you think caused the pattern of growth in
2008/2009?
NEW ZEALAND GDP GROWTH RATE Percent Change in Gross Domestic Product 1.51.3 1.5 0.9 0.9 0.8 0.809 0.6 0.5 0.5 0.5 0.2 0.1 0.2 0.1 0.2 0.5 0.5 2007 2008 2009 2010 2011 SOURCE: www.TRADINGECONOMICS.COM İ STATISTICS NEW ZEALAND
 Instructions: Enter your
responses rounded to the nearest billion.
a. Calculate real GDP for 2016 using 2000 prices.
$ billion
b. By how much did real GDP increase between 2000 and 2016?
$ billion
c. By how much did nominal GDP increase between 2000 and
2016?
$ billion
Refer to the data below (all values are in billions): Year Nominal GDP GDP Deflator (in Billions of Dollars) (Price Index 2009 100) 2000 2001 2002 2003 2004 2005 2006 2007 2008 2009...
Instructions: Enter your
responses rounded to the nearest billion.
a. Calculate real GDP for 2016 using 2000 prices.
$ billion
b. By how much did real GDP increase between 2000 and 2016?
$ billion
c. By how much did nominal GDP increase between 2000 and
2016?
$ billion
Refer to the data below (all values are in billions): Year Nominal GDP GDP Deflator (in Billions of Dollars) (Price Index 2009 100) 2000 2001 2002 2003 2004 2005 2006 2007 2008 2009...
Most questions answered within 3 hours.
-
Where is the error in this code sequence?
String s1 = "Hello";
String s2 = "ello";...
asked 10 months ago -
Financial data for Joel de Paris, Inc., for last year
follow:
Joel de Paris, Inc.
Balance...
asked 10 months ago -
Consider this reaction:
Al2(SO4)3 (aq)+ BaCl3
(aq) Al2Cl6 (aq)- +
3BaSO4(s) . What is the...
asked 10 months ago -
Suppose that Savneet is considering increasing her
recent random sample from 20 car rentals to 40...
asked 10 months ago -
Trucks arrive at an unloading terminal at an average rate of 120
per hour.
Trucks arrive...
asked 10 months ago -
Why are methanol and ethanol completely soluble in water while
octanol is not very little soluble....
asked 10 months ago -
A facilities manager at a university reads in a research report
that the mean amount of...
asked 10 months ago -
When the CuSO4 is rehydrated by adding water to the anhydrous
compound, is this an endothermic...
asked 10 months ago -
A ray of sunlight is passing from diamond into crown glass; the
angle of incidence is...
asked 10 months ago -
A block of mass 0.249 kg is placed on top of a light, vertical
spring of...
asked 10 months ago -
how do the kidneys compensate in the presences of acidosis
a) trigger hyperventilate
b) reserve acid...
asked 10 months ago -
Question 501 pts
The rental rate of capital to the firm increases. Which of the
following...
asked 10 months ago