

Homework Answers


Add Answer to:
1. In years 1 and 2, there are 2 goods produced in a given economy, sausages...
1. In years 1 and 2, there are 2 goods produced in a given economy, sausages...
 1. In years 1 and 2, there are 2 goods produced in a given economy, sausages and pens. In year 1, 10,000 sausages are produced and sold at $2 each, and in year 2, 20,000 sausages are produced and sold at $2.10 each. In year 1, 15,000 pens are sold for $2 dollars each and in year 2, 48,000 pens are sold for $3 each a) Calculate nominal GDP in years 1 and 2. b) Calculate real GDP in years...
3. Assume an economy in which only broccoli and cauliflower are produced. In year 1, 300...
 3. Assume an economy in which only broccoli and cauliflower are produced. In year 1, 300 million pounds of broccoli are produced and consumed, and its price is S0.50 per pound, while 400 million pounds of cauliflower are produced and consumed and its price is S0.40 per pound. In year 2 250 million pounds of broccoli are produced and consumed and its price is S0.50 per pound, while 400 million pounds of cauliflower are produced and its price is SO.80...
1. Suppose there are only 3 different goods produced and consumed in a closed economy. The...
 1. Suppose there are only 3 different goods produced and consumed in a closed economy. The following table shows the prices and quantities of each good consumed in 2002, 2003, 2004, and 2005. Price of a Quantity of Price Price of Quantity pair of a pair of of Quantity Year Apple of Apple shoes Breed of Breed 3001000 1500 shoes 2002 2003 500 600 15 100 1200 2004 80020 3501300 2005 900 25 500 Calculate nominal GDP in each of...
Assume an economy with which only broccoli and cauliflower are produced. In year 1, 500 million...
 Assume an economy with which only broccoli and cauliflower are produced. In year 1, 500 million pounds of broccoli are produced and consumed and its price is $0.5 per pound, while 300 million pounds of cauliflower are produced and consumed and its price is $0.8 per pound. In year 2, 400 million pounds of broccoli are produced and consumed and its price is S0.6 per pound, while 350 million pounds of cauliflower are produced and its price is $0.85 per...
Hello can someone help me answer this plz? Part C confuses me Exercise 4: Calculate Inflation...
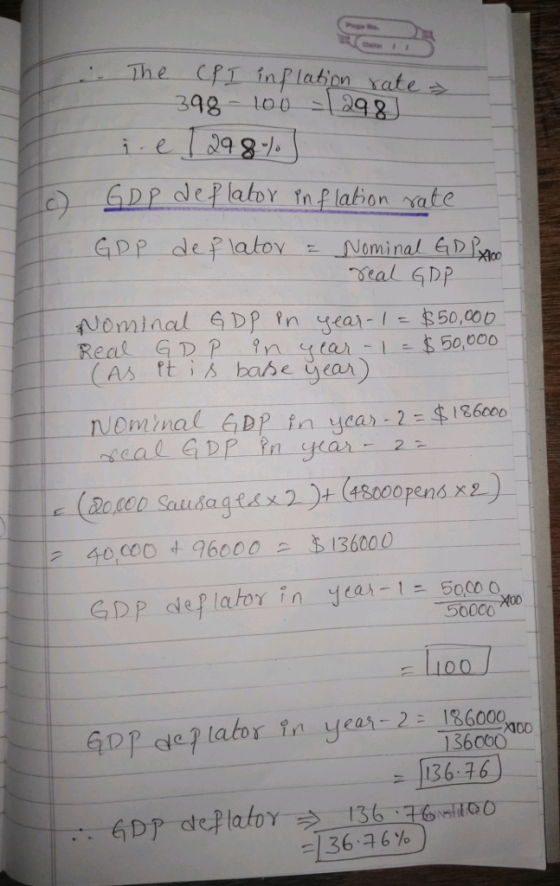
 Hello can someone help me answer this plz? Part C confuses me
Exercise 4: Calculate Inflation and Compare CPI vs GDP Deflator (14) Consider an economy in which pizzas and burgers are produced. In year 1, 20 million pounds of pizzas are produced and consumed, and the price of pizza is $2 per pound, while 40 million pounds of burgers are produced and consumed and the price of burger is $0.50 per pound. In year 2, 30 million pounds of...
Hello can someone help me answer this plz? Part C confuses me
Exercise 4: Calculate Inflation and Compare CPI vs GDP Deflator (14) Consider an economy in which pizzas and burgers are produced. In year 1, 20 million pounds of pizzas are produced and consumed, and the price of pizza is $2 per pound, while 40 million pounds of burgers are produced and consumed and the price of burger is $0.50 per pound. In year 2, 30 million pounds of...
5. Inflation and CPI Suppose in Economy A, the final goods produced in year 2015, 2016...
 5. Inflation and CPI Suppose in Economy A, the final goods produced in year 2015, 2016 and 2017 are milk, beef, gasoline, cloth. The quantities (Q) produced and prices (P) are given by the following: Year 2015 Qmilk Pmilk 200 2.35 220 2.49 233 2.79 (beer Pbeer lgasolin 120 3.30 400 123 3.35 430 145 3.47 440 Pgasoline (cloth Pcloth 1.12 510 2.33 1.15 512 2.47 1.20 523 2.67 2016 2017 Let 2015 be the base year and assume the...
The information in the table identifies the quantities of three goods produced in a simple economy...
 The information in the table identifies the quantities of three goods produced in a simple economy in 2018 and 2019, and the prices that the goods sold for in each of the two years. The base year is 2018. Item Quantity Price Price Quantity 2018 2018 2019 2019 2 $10 $11.53 4 Movie tickets 2 $3 $3.08 16 Bags of popcorn 16 $1 $1.45 Drinks of soda Based on the GDP deflator method, what was the rate of inflation between...
Consider an economy that only produces and consumes milk and cars. In the table are data...
Consider an economy that only produces and consumes milk and cars. In the table are data from 2 different years Year 2000 Year 2016 Price for a litre of milk $1 $2 # of milks produced 500 400 Price for a car $50 $100 # of cars produced 100 120 a) using the year 2000 as a base year, compute for 2000 and 2016 for the following statistics: nominal GDP, real GDP, price deflator and the CPI b) How much...
Consider an economy that only produces and consumes milk and cars. In table 1 are data...
 Consider an economy that only produces and consumes milk and cars. In table 1 are data from two different years. Table 1: GDP and Prices Year 2000 Year 2016 Number of milks produced Price of a car Number of cars produced S1$2 500 S50 100 400 $100 120 (a) Using the year 2000 as the base year, compute for 2000 and 2016 the following statistics: nominal GDP, real GDP, the price deflator and the CPI. 15 points b) How much...
The information in the table identifies the quantities of three goods produced in a simple economy...
 The information in the table identifies the quantities of three goods produced in a simple economy in 2018 and 2019, and the prices that the goods sold for in each of the two years. The base year is 2018. Item Quantity Price Price Quantity 2018 2018 2019 2019 2 $10 $11.86 14 Movie tickets 2 $3 $3.78 16 Bags of popcorn 16 $1 $ 1.69 16 Drinks of soda Based on the GDP deflator method, what was the rate of...
 1. In years 1 and 2, there are 2 goods produced in a given economy, sausages and pens. In year 1, 10,000 sausages are produced and sold at $2 each, and in year 2, 20,000 sausages are produced and sold at $2.10 each. In year 1, 15,000 pens are sold for $2 dollars each and in year 2, 48,000 pens are sold for $3 each a) Calculate nominal GDP in years 1 and 2. b) Calculate real GDP in years...
 3. Assume an economy in which only broccoli and cauliflower are produced. In year 1, 300 million pounds of broccoli are produced and consumed, and its price is S0.50 per pound, while 400 million pounds of cauliflower are produced and consumed and its price is S0.40 per pound. In year 2 250 million pounds of broccoli are produced and consumed and its price is S0.50 per pound, while 400 million pounds of cauliflower are produced and its price is SO.80...
 1. Suppose there are only 3 different goods produced and consumed in a closed economy. The following table shows the prices and quantities of each good consumed in 2002, 2003, 2004, and 2005. Price of a Quantity of Price Price of Quantity pair of a pair of of Quantity Year Apple of Apple shoes Breed of Breed 3001000 1500 shoes 2002 2003 500 600 15 100 1200 2004 80020 3501300 2005 900 25 500 Calculate nominal GDP in each of...
 Assume an economy with which only broccoli and cauliflower are produced. In year 1, 500 million pounds of broccoli are produced and consumed and its price is $0.5 per pound, while 300 million pounds of cauliflower are produced and consumed and its price is $0.8 per pound. In year 2, 400 million pounds of broccoli are produced and consumed and its price is S0.6 per pound, while 350 million pounds of cauliflower are produced and its price is $0.85 per...
 Hello can someone help me answer this plz? Part C confuses me
Exercise 4: Calculate Inflation and Compare CPI vs GDP Deflator (14) Consider an economy in which pizzas and burgers are produced. In year 1, 20 million pounds of pizzas are produced and consumed, and the price of pizza is $2 per pound, while 40 million pounds of burgers are produced and consumed and the price of burger is $0.50 per pound. In year 2, 30 million pounds of...
Hello can someone help me answer this plz? Part C confuses me
Exercise 4: Calculate Inflation and Compare CPI vs GDP Deflator (14) Consider an economy in which pizzas and burgers are produced. In year 1, 20 million pounds of pizzas are produced and consumed, and the price of pizza is $2 per pound, while 40 million pounds of burgers are produced and consumed and the price of burger is $0.50 per pound. In year 2, 30 million pounds of...
 5. Inflation and CPI Suppose in Economy A, the final goods produced in year 2015, 2016 and 2017 are milk, beef, gasoline, cloth. The quantities (Q) produced and prices (P) are given by the following: Year 2015 Qmilk Pmilk 200 2.35 220 2.49 233 2.79 (beer Pbeer lgasolin 120 3.30 400 123 3.35 430 145 3.47 440 Pgasoline (cloth Pcloth 1.12 510 2.33 1.15 512 2.47 1.20 523 2.67 2016 2017 Let 2015 be the base year and assume the...
 The information in the table identifies the quantities of three goods produced in a simple economy in 2018 and 2019, and the prices that the goods sold for in each of the two years. The base year is 2018. Item Quantity Price Price Quantity 2018 2018 2019 2019 2 $10 $11.53 4 Movie tickets 2 $3 $3.08 16 Bags of popcorn 16 $1 $1.45 Drinks of soda Based on the GDP deflator method, what was the rate of inflation between...
 Consider an economy that only produces and consumes milk and cars. In table 1 are data from two different years. Table 1: GDP and Prices Year 2000 Year 2016 Number of milks produced Price of a car Number of cars produced S1$2 500 S50 100 400 $100 120 (a) Using the year 2000 as the base year, compute for 2000 and 2016 the following statistics: nominal GDP, real GDP, the price deflator and the CPI. 15 points b) How much...
 The information in the table identifies the quantities of three goods produced in a simple economy in 2018 and 2019, and the prices that the goods sold for in each of the two years. The base year is 2018. Item Quantity Price Price Quantity 2018 2018 2019 2019 2 $10 $11.86 14 Movie tickets 2 $3 $3.78 16 Bags of popcorn 16 $1 $ 1.69 16 Drinks of soda Based on the GDP deflator method, what was the rate of...
Most questions answered within 3 hours.
-
Where is the error in this code sequence?
String s1 = "Hello";
String s2 = "ello";...
asked 11 months ago -
Financial data for Joel de Paris, Inc., for last year
follow:
Joel de Paris, Inc.
Balance...
asked 11 months ago -
Consider this reaction:
Al2(SO4)3 (aq)+ BaCl3
(aq) Al2Cl6 (aq)- +
3BaSO4(s) . What is the...
asked 11 months ago -
Suppose that Savneet is considering increasing her
recent random sample from 20 car rentals to 40...
asked 11 months ago -
Trucks arrive at an unloading terminal at an average rate of 120
per hour.
Trucks arrive...
asked 11 months ago -
Why are methanol and ethanol completely soluble in water while
octanol is not very little soluble....
asked 11 months ago -
A facilities manager at a university reads in a research report
that the mean amount of...
asked 11 months ago -
When the CuSO4 is rehydrated by adding water to the anhydrous
compound, is this an endothermic...
asked 11 months ago -
A ray of sunlight is passing from diamond into crown glass; the
angle of incidence is...
asked 11 months ago -
A block of mass 0.249 kg is placed on top of a light, vertical
spring of...
asked 11 months ago -
how do the kidneys compensate in the presences of acidosis
a) trigger hyperventilate
b) reserve acid...
asked 11 months ago -
Question 501 pts
The rental rate of capital to the firm increases. Which of the
following...
asked 11 months ago