Finance Question: Confused about different ways to calculate
Returns. I'm supposed to take all of the values ( i assume of which
are returns for these index and make three new series for 12-month
rolling annual returns. What does 12 month rolling annual returns
mean mathematically? like return from Dec '17 divided by Dec '16
then next value would be Jan '17/Jan'16 and so
on? 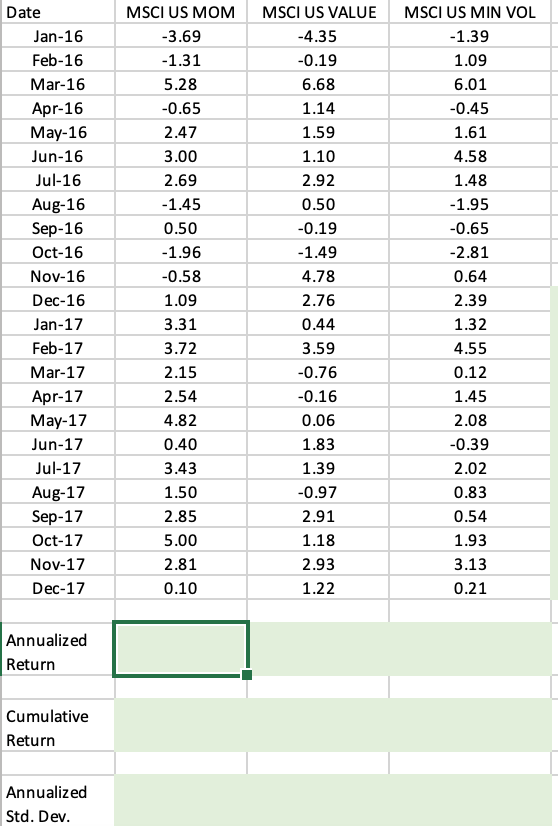
Homework Answers
Add Answer to:
Finance Question: Confused about different ways to calculate
Returns. I'm supposed to take all of the...
If there are any seasonality or relationship between the price and the US oil price? How...
If there are any seasonality or relationship between the price and the US oil price? How to analyze? Jan-10 2.769 Jan-11 3.148 Jan-12 3.44 Jan-13 3.391 Jan-14 3.392 Feb-10 2.699 Feb-11 3.264 Feb-12 3.64 Feb-13 3.736 Feb-14 3.434 Mar-10 2.824 Mar-11 3.615 Mar-12 3.907 Mar-13 3.779 Mar-14 3.606 Apr-10 2.9 Apr-11 3.852 Apr-12 3.958 Apr-13 3.638 Apr-14 3.735 May-10 2.89 May-11 3.96 May-12 3.791 May-13 3.675 May-14 3.75 Jun-10 2.785 Jun-11 3.735 Jun-12 3.596 Jun-13 3.689 Jun-14 3.766 Jul-10 2.782...
calculate the monthly time-weighted and money weighted returns for shareholders in the ADKSX with using excel....
calculate the monthly time-weighted and money weighted returns for shareholders in the ADKSX with using excel. In a text box nearby, comment on whether investors’ trading decisions have created value. Month ADKSX Return (%) ADKSX Cash Flow ($) Nov-09 3.49 -$10,648,393 Dec-09 6.93 -$618,800 Jan-10 -2.05 $940,820 Feb-10 5.74 -$2,484,437 Mar-10 5.19 -$3,699,836 Apr-10 5.48 -$1,379,757 May-10 -4.68 $2,145,936 Jun-10 -6.31 -$2,953,884 Jul-10 5.9 -$4,160,472 Aug-10 -5.18 $1,096,304 Sep-10 8.61 -$5,571,657 Oct-10 4.5 -$669,464 Nov-10 2.77 -$3,145,367 Dec-10 9.16 -$6,162,018...
Calculate the sample correlation coefficient rxy. Calculate the value of the test statistic. Date Energy Healthcare...
Calculate the sample correlation coefficient rxy. Calculate the value of the test statistic. Date Energy Healthcare Jan-10 -4.87 -0.15 Feb-10 1.8 0.53 Mar-10 2.26 1.41 Apr-10 3.03 -3.75 May-10 -11.5 -5.12 Jun-10 -5.67 -0.52 Jul-10 8.73 1.49 Aug-10 -5.99 -0.97 Sep-10 10.15 8.24 Oct-10 3.89 2.28 Nov-10 2.85 -2.52 Dec-10 5.55 1.4 Jan-11 6.6 1.55 Feb-11 5.7 3.04 Mar-11 1.32 1.22 Apr-11 1.64 5.89 May-11 -4.06 2.62 Jun-11 -2.08 -0.55 Jul-11 1.14 -2.64 Aug-11 -10.41 -2.8 Sep-11 -15.06 -4.17 Oct-11...
Consider five years of monthly sales data for a company in the attached file (Q5.xlsx). a) Foreca...
 Consider five years of monthly sales data for a company in the
attached file (Q5.xlsx). a) Forecast monthly sales for the next
year (2020). (10 marks) b) Discuss whether a simple exponential
smoothing model works well with this data or not. (5 m
7 9 Month Sales 747 Feb-14 697 Mar-14 1014 Jan-14 Ap4 1126 May-14 1105 Jun-14 1450 Jul-14 1633 Aug-14 1711 Sep-14 1307 Oct-1223 Nov-14 9T5 Dec-14S53 4J-15 1024 Feb-15928 Mar-151442 7Apr-151371 May-15 1536 Ju15 2004 Jul-15 1854...
Consider five years of monthly sales data for a company in the
attached file (Q5.xlsx). a) Forecast monthly sales for the next
year (2020). (10 marks) b) Discuss whether a simple exponential
smoothing model works well with this data or not. (5 m
7 9 Month Sales 747 Feb-14 697 Mar-14 1014 Jan-14 Ap4 1126 May-14 1105 Jun-14 1450 Jul-14 1633 Aug-14 1711 Sep-14 1307 Oct-1223 Nov-14 9T5 Dec-14S53 4J-15 1024 Feb-15928 Mar-151442 7Apr-151371 May-15 1536 Ju15 2004 Jul-15 1854...
Given the following history, use a three-quarter moving average to forecast the demand for the third...
Given the following history, use a three-quarter moving average to forecast the demand for the third quarter of this year. Note, the 1st quarter is Jan, Feb, and Mar; 2nd quarter Apr, May, Jun; 3rd quarter Jul, Aug, Sep; and 4th quarter Oct, Nov, Dec. JAN FEB MAR APR MAY JUN JUL AUG SEP OCT NOV DEC Last year 170 200 210 240 250 270 225 215 215 275 280 300 This year 205 210 140 255 245 220 Forecast...
Date Gasoline Crude Oil Jan 01, 2010 2.031 79.07 Jan 08, 2010 2.124 82.34 Jan 15,...
 Date Gasoline Crude Oil
Jan 01, 2010 2.031 79.07
Jan 08, 2010 2.124 82.34
Jan 15, 2010 2.079 80.06
Jan 22, 2010 2.010 76.62
Jan 29, 2010 1.942 73.94
Feb 05, 2010 1.885 74.57
Feb 12, 2010 1.908 73.88
Feb 19, 2010 2.031 78.25
Feb 26, 2010 2.042 79.22
Mar 05, 2010 2.127 80.19
Mar 12, 2010 2.154 81.76
Mar 19, 2010 2.150 81.44
Mar 26, 2010 2.118 80.65
Apr 02, 2010 2.191 83.01
Apr 09, 2010 2.238 85.66
Apr...
Date Gasoline Crude Oil
Jan 01, 2010 2.031 79.07
Jan 08, 2010 2.124 82.34
Jan 15, 2010 2.079 80.06
Jan 22, 2010 2.010 76.62
Jan 29, 2010 1.942 73.94
Feb 05, 2010 1.885 74.57
Feb 12, 2010 1.908 73.88
Feb 19, 2010 2.031 78.25
Feb 26, 2010 2.042 79.22
Mar 05, 2010 2.127 80.19
Mar 12, 2010 2.154 81.76
Mar 19, 2010 2.150 81.44
Mar 26, 2010 2.118 80.65
Apr 02, 2010 2.191 83.01
Apr 09, 2010 2.238 85.66
Apr...
Moving average (MA) Calculate the sales using 2, 3, 4, 5, and 6 month moving average...
Moving average (MA) Calculate the sales using 2, 3, 4, 5, and 6 month moving average values. Forecast and plot the upcoming period’s sales using the moving average series that fits best. Explain why you chose that particular MA. Why is it inadvisable to use the Moving Average approach to forecast far into the future? Month Sale Month Sale Month Sale Oct-12 13.30 Oct-13 24.01 Oct-14 50.56 Nov-12 1.70 Nov-13 32.67 Nov-14 60.06 Dec-12 11.44 Dec-13 23.19 Dec-14 61.73 Jan-13...
Trends Which trend line do you think best fits the following data? Plot your chosen trend...
Trends Which trend line do you think best fits the following data? Plot your chosen trend line and explain why you chose that particular type of trend line. Month Sales Month Sales Month Sales Oct-12 12.50 Oct-13 33.53 Oct-14 43.31 Nov-12 19.78 Nov-13 32.88 Nov-14 44.17 Dec-12 14.58 Dec-13 45.59 Dec-14 59.66 Jan-13 19.85 Jan-14 35.85 Jan-15 56.00 Feb-13 14.15 Feb-14 22.49 Feb-15 54.95 Mar-13 8.82 Mar-14 38.94 Mar-15 40.78 Apr-13 (3.52) Apr-14 19.90 Apr-15 42.10 May-13 10.96 May-14 16.65...
From the following monthly stock prices assume rf of 0.5% per month and calculate 1.Monthly growth...
 From the following monthly stock prices assume rf of 0.5% per
month and calculate
1.Monthly growth return
2.CAPM and beta
3.Average return
4.Variance
5.Covariance
6. Assume a credit rating and calculate a VAT assuming debt to
equity structure
1 date share price benchmark 2 Mar 18 3 Feb-18 4 Jan-18 5 Dec-17 6 Nov-17 7 Oct-17 8 Sep-17 304.85 24,263.35 322.3 25,107.40 354.4 27,379.45 315.15 25,539.45 306.9 25,332.40 314.25 25,019.35 350 24.053.00 350.61 24,318.40 361.9 25,103.65 292.7 23,211.20 286.27 23,424.80...
From the following monthly stock prices assume rf of 0.5% per
month and calculate
1.Monthly growth return
2.CAPM and beta
3.Average return
4.Variance
5.Covariance
6. Assume a credit rating and calculate a VAT assuming debt to
equity structure
1 date share price benchmark 2 Mar 18 3 Feb-18 4 Jan-18 5 Dec-17 6 Nov-17 7 Oct-17 8 Sep-17 304.85 24,263.35 322.3 25,107.40 354.4 27,379.45 315.15 25,539.45 306.9 25,332.40 314.25 25,019.35 350 24.053.00 350.61 24,318.40 361.9 25,103.65 292.7 23,211.20 286.27 23,424.80...
PLEASE HELP... NO ONE WILL ANSWER THIS QUESTION. home / study / business / finance / finance questions and answers / con...
PLEASE HELP... NO ONE WILL ANSWER THIS QUESTION. home / study / business / finance / finance questions and answers / consider the monthly returns of ford motor company and general electric shown on the next page. ... Question: Consider the monthly returns of Ford Motor Company and General Electric shown on the next page. A... Consider the monthly returns of Ford Motor Company and General Electric shown on the next page. An Excel spreadsheet with the data is also...
 Consider five years of monthly sales data for a company in the
attached file (Q5.xlsx). a) Forecast monthly sales for the next
year (2020). (10 marks) b) Discuss whether a simple exponential
smoothing model works well with this data or not. (5 m
7 9 Month Sales 747 Feb-14 697 Mar-14 1014 Jan-14 Ap4 1126 May-14 1105 Jun-14 1450 Jul-14 1633 Aug-14 1711 Sep-14 1307 Oct-1223 Nov-14 9T5 Dec-14S53 4J-15 1024 Feb-15928 Mar-151442 7Apr-151371 May-15 1536 Ju15 2004 Jul-15 1854...
Consider five years of monthly sales data for a company in the
attached file (Q5.xlsx). a) Forecast monthly sales for the next
year (2020). (10 marks) b) Discuss whether a simple exponential
smoothing model works well with this data or not. (5 m
7 9 Month Sales 747 Feb-14 697 Mar-14 1014 Jan-14 Ap4 1126 May-14 1105 Jun-14 1450 Jul-14 1633 Aug-14 1711 Sep-14 1307 Oct-1223 Nov-14 9T5 Dec-14S53 4J-15 1024 Feb-15928 Mar-151442 7Apr-151371 May-15 1536 Ju15 2004 Jul-15 1854...
 Date Gasoline Crude Oil
Jan 01, 2010 2.031 79.07
Jan 08, 2010 2.124 82.34
Jan 15, 2010 2.079 80.06
Jan 22, 2010 2.010 76.62
Jan 29, 2010 1.942 73.94
Feb 05, 2010 1.885 74.57
Feb 12, 2010 1.908 73.88
Feb 19, 2010 2.031 78.25
Feb 26, 2010 2.042 79.22
Mar 05, 2010 2.127 80.19
Mar 12, 2010 2.154 81.76
Mar 19, 2010 2.150 81.44
Mar 26, 2010 2.118 80.65
Apr 02, 2010 2.191 83.01
Apr 09, 2010 2.238 85.66
Apr...
Date Gasoline Crude Oil
Jan 01, 2010 2.031 79.07
Jan 08, 2010 2.124 82.34
Jan 15, 2010 2.079 80.06
Jan 22, 2010 2.010 76.62
Jan 29, 2010 1.942 73.94
Feb 05, 2010 1.885 74.57
Feb 12, 2010 1.908 73.88
Feb 19, 2010 2.031 78.25
Feb 26, 2010 2.042 79.22
Mar 05, 2010 2.127 80.19
Mar 12, 2010 2.154 81.76
Mar 19, 2010 2.150 81.44
Mar 26, 2010 2.118 80.65
Apr 02, 2010 2.191 83.01
Apr 09, 2010 2.238 85.66
Apr...
 From the following monthly stock prices assume rf of 0.5% per
month and calculate
1.Monthly growth return
2.CAPM and beta
3.Average return
4.Variance
5.Covariance
6. Assume a credit rating and calculate a VAT assuming debt to
equity structure
1 date share price benchmark 2 Mar 18 3 Feb-18 4 Jan-18 5 Dec-17 6 Nov-17 7 Oct-17 8 Sep-17 304.85 24,263.35 322.3 25,107.40 354.4 27,379.45 315.15 25,539.45 306.9 25,332.40 314.25 25,019.35 350 24.053.00 350.61 24,318.40 361.9 25,103.65 292.7 23,211.20 286.27 23,424.80...
From the following monthly stock prices assume rf of 0.5% per
month and calculate
1.Monthly growth return
2.CAPM and beta
3.Average return
4.Variance
5.Covariance
6. Assume a credit rating and calculate a VAT assuming debt to
equity structure
1 date share price benchmark 2 Mar 18 3 Feb-18 4 Jan-18 5 Dec-17 6 Nov-17 7 Oct-17 8 Sep-17 304.85 24,263.35 322.3 25,107.40 354.4 27,379.45 315.15 25,539.45 306.9 25,332.40 314.25 25,019.35 350 24.053.00 350.61 24,318.40 361.9 25,103.65 292.7 23,211.20 286.27 23,424.80...
Most questions answered within 3 hours.
-
Where is the error in this code sequence?
String s1 = "Hello";
String s2 = "ello";...
asked 11 months ago -
Financial data for Joel de Paris, Inc., for last year
follow:
Joel de Paris, Inc.
Balance...
asked 11 months ago -
Consider this reaction:
Al2(SO4)3 (aq)+ BaCl3
(aq) Al2Cl6 (aq)- +
3BaSO4(s) . What is the...
asked 11 months ago -
Suppose that Savneet is considering increasing her
recent random sample from 20 car rentals to 40...
asked 11 months ago -
Trucks arrive at an unloading terminal at an average rate of 120
per hour.
Trucks arrive...
asked 11 months ago -
Why are methanol and ethanol completely soluble in water while
octanol is not very little soluble....
asked 11 months ago -
A facilities manager at a university reads in a research report
that the mean amount of...
asked 11 months ago -
When the CuSO4 is rehydrated by adding water to the anhydrous
compound, is this an endothermic...
asked 11 months ago -
A ray of sunlight is passing from diamond into crown glass; the
angle of incidence is...
asked 11 months ago -
A block of mass 0.249 kg is placed on top of a light, vertical
spring of...
asked 11 months ago -
how do the kidneys compensate in the presences of acidosis
a) trigger hyperventilate
b) reserve acid...
asked 11 months ago -
Question 501 pts
The rental rate of capital to the firm increases. Which of the
following...
asked 11 months ago