
Homework Answers
Refer the attached picture for the Demand and Supply Curve
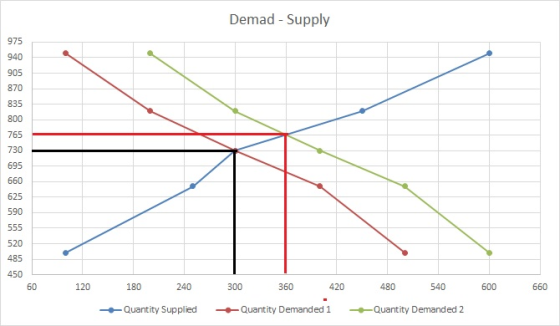
b. Equilibrium Price = $ 730
and Equilibrium Quantity = 300
Refer the graph above all the curves have been labeled.
After the shift in demand curve the new equilibrium quantity = 360
equilibrium price = $ 765
e. The shift in demand may be due to the following reasons
- When price of related good changes then also the quantity demanded shift rightwards.
- Due to expectation, when people expect the price of the good to increase in future then the immediately the quantity demanded will increase and it will shift to its right.
- When the total popu;lation increases then the total demand increases for all the prices. Hence the demand curve will shift rightwards.
Please contact if having any query will be obliged to you for your generous support. Your help mean a lot to me, please help. Thank you.
Add Answer to:
You can either type your answers or you can write them in, scan and then submit...
Spply and Demand The table below shows the market for olives (the quantities are in thousands...
 Spply and Demand The table below shows the market for olives (the quantities are in thousands of kilos per year). Plot the demand and supply curves on the graph below and label them D and S for demand and supply. Be sure to include prices and quantities on the axes. What are the values for the equilibrium price and quantity? Prices Quantity Demanded Quantity Supplied 8 10 12 14 700 600 500 400 300 200 100 100 200 300 100...
Answer the questions below in a separate file or scan your pencil and paper answers and...
Answer the questions below in a separate file or scan your pencil and paper answers and then attach the file. A) Draw a graph of the supply and demand curves for imported cotton. Make sure you label everything. (Note: Use the endpoints to draw the curves.) B) What is the equilibrium quantity and price? C) Which curve is the more elastic? Which curve is the least elastic? D) Calculate the Price Elasticities for the following; ( Show your calculations) Curve Price...
Price (Dollars per TV set) Quantity Demanded Quantity Supplied 100 900 200 700 200 500 300...
 Price (Dollars per TV set) Quantity Demanded Quantity Supplied 100 900 200 700 200 500 300 400 550 400 600 900 Use blue points (circle symbol) to plot Venezuela's demand curve on the following graph. Use orange points (square symbol) to plot Venezuela's supply curve. Then use the black point (cross symbol) to indicate the domestic market equilibrium. (Hint: Use all of the given points to plot the demand and supply curves.) Demand O Supply PRICE (Dollars per TV set)...
1. The following table shows the supply and demand schedules in a market. Quantity Demanded 800...
 1. The following table shows the supply and demand schedules in a market. Quantity Demanded 800 Quantity Supplied 0 100 Price $2 $10 $12 $14 $16 500 400 300 200 100 0 300 400 500 600 800 (1 point) Graph the demand and supply curves. (0.5 points) What is the equilibrium price in this market? (0.5 points) What is the equilibrium quantity in this market?
Supply and Demand Data for Ice Cream (one gallon containers) Price OD QS OD1 $2.00 700...
 Supply and Demand Data for Ice Cream (one gallon containers) Price OD QS OD1 $2.00 700 300 $2.50 600 400 $3.00 500 500 $3.50 400 600 $4.00 300 700 $4.50 200 800 Graph the data in the blank space above. Make sure to label P, Q, S, D, andE What is the Equilibrium Price and Quantity? At a price of $2.00, there will be a At a price of $4.00, there will be a Now suppose the price per gallon...
I have the answers for A, B, C, D, and E. Please answer F): F) What...
 I have the answers for A, B, C, D, and E. Please answer F):
F) What is the new equilibrium price and quantity? (1 mark)
Thank you.
4. T he following table shows the market for wool in the economy of Odessa (quantities are in tonnes per year). Price (S) Price($ Quantity Demanded 100-200 300-400-500-T600-700 160 140 1020- 100-180-60-40 1800170011 60 40 Quantity Supplied 10 20 30 40 50 60 70 a) Plot the demand and supply curves on the...
I have the answers for A, B, C, D, and E. Please answer F):
F) What is the new equilibrium price and quantity? (1 mark)
Thank you.
4. T he following table shows the market for wool in the economy of Odessa (quantities are in tonnes per year). Price (S) Price($ Quantity Demanded 100-200 300-400-500-T600-700 160 140 1020- 100-180-60-40 1800170011 60 40 Quantity Supplied 10 20 30 40 50 60 70 a) Plot the demand and supply curves on the...
(Figure: The Demand for Shirts) Use Figure: The Demand for Shirts. The Demand for Shirts. At...
 (Figure: The Demand for Shirts) Use Figure: The Demand for
Shirts. The Demand for Shirts. At a price of $40, total revenue
is:
$40.
$8,000.
$200.
$4,000.
Figure: The Demand for Shirts Price of shirts $60 100 200 300 400 500 600 Quantity demanded (per day)
(Figure: The Demand for Shirts) Use Figure: The Demand for
Shirts. The Demand for Shirts. At a price of $40, total revenue
is:
$40.
$8,000.
$200.
$4,000.
Figure: The Demand for Shirts Price of shirts $60 100 200 300 400 500 600 Quantity demanded (per day)
D Question 14 1 pts Figure 3.2 Price $40 30 20 10 100 200 300 400...
 D Question 14 1 pts Figure 3.2 Price $40 30 20 10 100 200 300 400 500 600 700 800 Quantity According to the graph, at the equilibrium price O 400 units would be supplied and demanded. 600 units would be supplied, but only 200 would be demanded. O 200 units would be supplied and demanded. O 600 units would be supplied and demanded.
15 pts READ EACH QUESTION CAREFULLY AND WRITE YOUR ANSWERS IN THE SPACE PROVIDED. EXPLAIN YOUR ANSWERS. FOR EAC...
 15 pts READ EACH QUESTION CAREFULLY AND WRITE YOUR ANSWERS IN THE SPACE PROVIDED. EXPLAIN YOUR ANSWERS. FOR EACH OF THE FOLLOWING PAIRS OF GOODS, IDENTIFY WHICH GOOD HAS THE HIGHER PRICE ELASTICITY OF DEMAND. {I.E. MORE ELASTIC} INSULIN FOR A DIABETIC VS DIALYSIS TREATMENT FOR SOMEONE WITH A KIDNEY DISEASE Thelastic Elastic GAS CONSUMED EACH YEAR VS GAS CONSUMED EACH WEEK 8 10 pts CALCULATE THE PRICE ELASTICITY OF DEMAND & SUPPLY BETWEEN ALL PRICES IN THE FOLLOWING TABLE:...
Please answer the question d. at list if possible. Thanks in advance. foreign automakers that sell...
 Please answer the question d. at list if possible. Thanks in
advance.
foreign automakers that sell trucks in the US. It can do this by imposing an excise tax on each foreign truck sold in the US. The hypothetical pre-tax demand and supply schedule are given below: in thousands of trucks Price of imported truck Quantity Demanded 32,000 31,000 30,000 29,000 28,000 27,000 100 200 300 400 500 600 Quantity Supplied 400 350 300 250 200 150 a. In the...
Please answer the question d. at list if possible. Thanks in
advance.
foreign automakers that sell trucks in the US. It can do this by imposing an excise tax on each foreign truck sold in the US. The hypothetical pre-tax demand and supply schedule are given below: in thousands of trucks Price of imported truck Quantity Demanded 32,000 31,000 30,000 29,000 28,000 27,000 100 200 300 400 500 600 Quantity Supplied 400 350 300 250 200 150 a. In the...
 Spply and Demand The table below shows the market for olives (the quantities are in thousands of kilos per year). Plot the demand and supply curves on the graph below and label them D and S for demand and supply. Be sure to include prices and quantities on the axes. What are the values for the equilibrium price and quantity? Prices Quantity Demanded Quantity Supplied 8 10 12 14 700 600 500 400 300 200 100 100 200 300 100...
 Price (Dollars per TV set) Quantity Demanded Quantity Supplied 100 900 200 700 200 500 300 400 550 400 600 900 Use blue points (circle symbol) to plot Venezuela's demand curve on the following graph. Use orange points (square symbol) to plot Venezuela's supply curve. Then use the black point (cross symbol) to indicate the domestic market equilibrium. (Hint: Use all of the given points to plot the demand and supply curves.) Demand O Supply PRICE (Dollars per TV set)...
 1. The following table shows the supply and demand schedules in a market. Quantity Demanded 800 Quantity Supplied 0 100 Price $2 $10 $12 $14 $16 500 400 300 200 100 0 300 400 500 600 800 (1 point) Graph the demand and supply curves. (0.5 points) What is the equilibrium price in this market? (0.5 points) What is the equilibrium quantity in this market?
 Supply and Demand Data for Ice Cream (one gallon containers) Price OD QS OD1 $2.00 700 300 $2.50 600 400 $3.00 500 500 $3.50 400 600 $4.00 300 700 $4.50 200 800 Graph the data in the blank space above. Make sure to label P, Q, S, D, andE What is the Equilibrium Price and Quantity? At a price of $2.00, there will be a At a price of $4.00, there will be a Now suppose the price per gallon...
 I have the answers for A, B, C, D, and E. Please answer F):
F) What is the new equilibrium price and quantity? (1 mark)
Thank you.
4. T he following table shows the market for wool in the economy of Odessa (quantities are in tonnes per year). Price (S) Price($ Quantity Demanded 100-200 300-400-500-T600-700 160 140 1020- 100-180-60-40 1800170011 60 40 Quantity Supplied 10 20 30 40 50 60 70 a) Plot the demand and supply curves on the...
I have the answers for A, B, C, D, and E. Please answer F):
F) What is the new equilibrium price and quantity? (1 mark)
Thank you.
4. T he following table shows the market for wool in the economy of Odessa (quantities are in tonnes per year). Price (S) Price($ Quantity Demanded 100-200 300-400-500-T600-700 160 140 1020- 100-180-60-40 1800170011 60 40 Quantity Supplied 10 20 30 40 50 60 70 a) Plot the demand and supply curves on the...
 (Figure: The Demand for Shirts) Use Figure: The Demand for
Shirts. The Demand for Shirts. At a price of $40, total revenue
is:
$40.
$8,000.
$200.
$4,000.
Figure: The Demand for Shirts Price of shirts $60 100 200 300 400 500 600 Quantity demanded (per day)
(Figure: The Demand for Shirts) Use Figure: The Demand for
Shirts. The Demand for Shirts. At a price of $40, total revenue
is:
$40.
$8,000.
$200.
$4,000.
Figure: The Demand for Shirts Price of shirts $60 100 200 300 400 500 600 Quantity demanded (per day)
 D Question 14 1 pts Figure 3.2 Price $40 30 20 10 100 200 300 400 500 600 700 800 Quantity According to the graph, at the equilibrium price O 400 units would be supplied and demanded. 600 units would be supplied, but only 200 would be demanded. O 200 units would be supplied and demanded. O 600 units would be supplied and demanded.
 15 pts READ EACH QUESTION CAREFULLY AND WRITE YOUR ANSWERS IN THE SPACE PROVIDED. EXPLAIN YOUR ANSWERS. FOR EACH OF THE FOLLOWING PAIRS OF GOODS, IDENTIFY WHICH GOOD HAS THE HIGHER PRICE ELASTICITY OF DEMAND. {I.E. MORE ELASTIC} INSULIN FOR A DIABETIC VS DIALYSIS TREATMENT FOR SOMEONE WITH A KIDNEY DISEASE Thelastic Elastic GAS CONSUMED EACH YEAR VS GAS CONSUMED EACH WEEK 8 10 pts CALCULATE THE PRICE ELASTICITY OF DEMAND & SUPPLY BETWEEN ALL PRICES IN THE FOLLOWING TABLE:...
 Please answer the question d. at list if possible. Thanks in
advance.
foreign automakers that sell trucks in the US. It can do this by imposing an excise tax on each foreign truck sold in the US. The hypothetical pre-tax demand and supply schedule are given below: in thousands of trucks Price of imported truck Quantity Demanded 32,000 31,000 30,000 29,000 28,000 27,000 100 200 300 400 500 600 Quantity Supplied 400 350 300 250 200 150 a. In the...
Please answer the question d. at list if possible. Thanks in
advance.
foreign automakers that sell trucks in the US. It can do this by imposing an excise tax on each foreign truck sold in the US. The hypothetical pre-tax demand and supply schedule are given below: in thousands of trucks Price of imported truck Quantity Demanded 32,000 31,000 30,000 29,000 28,000 27,000 100 200 300 400 500 600 Quantity Supplied 400 350 300 250 200 150 a. In the...
Most questions answered within 3 hours.
-
Where is the error in this code sequence?
String s1 = "Hello";
String s2 = "ello";...
asked 10 months ago -
Financial data for Joel de Paris, Inc., for last year
follow:
Joel de Paris, Inc.
Balance...
asked 10 months ago -
Consider this reaction:
Al2(SO4)3 (aq)+ BaCl3
(aq) Al2Cl6 (aq)- +
3BaSO4(s) . What is the...
asked 10 months ago -
Suppose that Savneet is considering increasing her
recent random sample from 20 car rentals to 40...
asked 10 months ago -
Trucks arrive at an unloading terminal at an average rate of 120
per hour.
Trucks arrive...
asked 10 months ago -
Why are methanol and ethanol completely soluble in water while
octanol is not very little soluble....
asked 10 months ago -
A facilities manager at a university reads in a research report
that the mean amount of...
asked 10 months ago -
When the CuSO4 is rehydrated by adding water to the anhydrous
compound, is this an endothermic...
asked 10 months ago -
A ray of sunlight is passing from diamond into crown glass; the
angle of incidence is...
asked 10 months ago -
A block of mass 0.249 kg is placed on top of a light, vertical
spring of...
asked 10 months ago -
how do the kidneys compensate in the presences of acidosis
a) trigger hyperventilate
b) reserve acid...
asked 10 months ago -
Question 501 pts
The rental rate of capital to the firm increases. Which of the
following...
asked 10 months ago