
Homework Answers
3.
MPL = Change in output per unit rise in labor
Cost of per student hired = 20
TC = Cost of equipment + cost of student
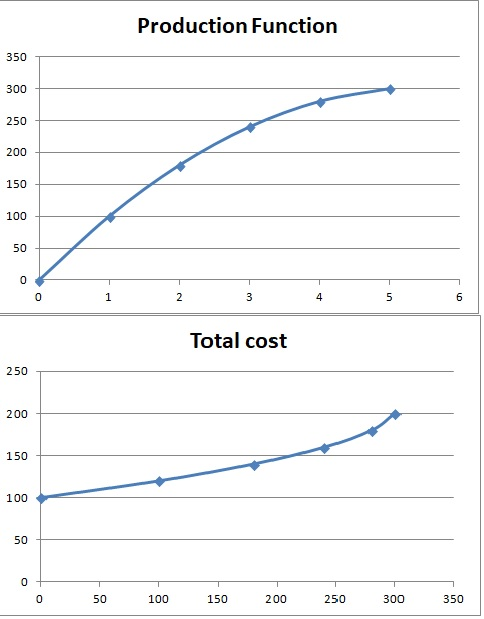
| Students | Output | MPL | Cost of equipment | Cost of student hired | TC |
| 0 | 0.00 | 100 | 0 | 100 | |
| 1 | 100.00 | 100 | 100 | 20 | 120 |
| 2 | 180.00 | 80 | 100 | 40 | 140 |
| 3 | 240.00 | 60 | 100 | 60 | 160 |
| 4 | 280.00 | 40 | 100 | 80 | 180 |
| 5 | 300.00 | 20 | 100 | 100 | 200 |
Production function is output vs no. of students hired
Total cost is plotted vs total output
Pls upload rest of the questions separately as HOMEWORKLIB Policy
Add Answer to:
b) If this is a perfectly competitive market, what is the equilibrium quantity and price? Answer:...
3. The economic student association at the University X is hiring students to make banners "I...
 3. The economic student association at the University X is hiring students to make banners "I love economics” for the coming conference. Complete the following table and plot the production function and the cost function for producing banners. (Marks 10) Number of Output Marginal Cost of Cost of Total Cost Students Product of Equipment Students Hired Hired Labour 100 100 100 140 100 100 180 300 100
3. The economic student association at the University X is hiring students to make banners “I...
 3. The economic student association at the University X is hiring students to make banners “I love economics” for the coming conference. Complete the following table and plot the production function and the cost function for producing banners. (Marks 10) Number of Output Marginal Cost of Cost of Total Cost Students Product of Equipment Students Hired Hired Labour 100 100 100 140 240 100 180 300 100
[1] A perfectly competitive aluminum producer is currently producing a quantity where the market price is...
[1] A perfectly competitive aluminum producer is currently producing a quantity where the market price is $0.67 per pound (i.e., 67 cents per pound), average total cost is $0.70, and average variable cost of $0.60 (which corresponds to the minimum point on the average variable cost curve). Would you recommend this firm expand output, contract output, or shut down in the short-run? Provide a graph to illustrate your answer. [2] Suppose the local crawfish market is perfectly competitive, with the...
4. If you are operating a business in a perfectly competitive market. You can sell as...
 4. If you are operating a business in a perfectly competitive market. You can sell as much as at the market price. Why can you not simply increase your profits by selling a highest quantity? (10 marks) Answer:
4. If you are operating a business in a perfectly competitive market. You can sell as...
 4. If you are operating a business in a perfectly competitive market. You can sell as much as at the market price. Why can you not simply increase your profits by selling a highest quantity? (10 marks) Answer: 5. Your company operates in a perfectly competitive market. Your Manager told you that advertising can help you increase your sales in the short run. What kind of advertising campaign you will start for your product and how much gain is expected...
15. Use the following figure for a firm in a perfectly competitive market. a What is the output that maximizes...
 15. Use the following figure for a firm in a perfectly competitive market. a What is the output that maximizes the firm's profit? b. At the profit-maximizing output, calculate total revenue and total cost. C. If the firm maximizes profit, how much profit does it earn? d. What will likely happen to market demand or market supply in the long run? e. What will likely happen to the market price in the long run? Price (s) d = P =...
Market perfectly competitive Current market equilibrium price = $15 Short run total cost of TC= 0.5q^2...
Market perfectly competitive Current market equilibrium price = $15 Short run total cost of TC= 0.5q^2 Profit maximization? Total revenue? TC= aQ^2-bQ+c where, a,b,c are positive constants. For this cost function AC is minimum at the output level where, AC=MC Monopolist seller faces an inverse demand curve P=40-0.5Q and the monopolist can produce at a constant marginal cost of $5 How many units will an unregulated profit maximization monopolist sell? If the government imposes a price ceiling of $6, how...
2. Consider the following exph (10 marks) Zoom ATC Ne The graph above shows the demand...
 2. Consider the following exph (10 marks) Zoom ATC Ne The graph above shows the demand curve (D), marginal cost curve (MC), average cout exurve (AC), and marginal revenue curve (MR) for a monopolist. a) What is the profit maximizing quantity and price for the monopolist? Answer b) If this is a perfectly competitive market, what is the equilibrium quantity and price? Answer: c) What area represents the deadweight loss caused by the monopolist? Answer:
V OIVERSITY 2. Consider the following graph (10 marks) ATC NER Q1 Q2 Q3 Q4 The...
 V OIVERSITY 2. Consider the following graph (10 marks) ATC NER Q1 Q2 Q3 Q4 The graph above shows the demand curve (D), marginal cost curve (MC), average cost curve (AC), and marginal revenue curve (MR) for a monopolist. a) What is the profit maximizing quantity and price for the monopolist? Answer: b) If this is a perfectly competitive market, what is the equilibrium quantity and price? Answer: c) What area represents the deadweight loss caused by the monopolist? Answer:
A price-taking firm in a perfectly competitive market faces a market price of $4. The firm's...
A price-taking firm in a perfectly competitive market faces a market price of $4. The firm's marginal cost function is MC(Q) = 2 + aQ, where "a" is a positive number. As "a" increases, the firm's profit-maximizing quantity increases, decreases, or does not change?
 3. The economic student association at the University X is hiring students to make banners "I love economics” for the coming conference. Complete the following table and plot the production function and the cost function for producing banners. (Marks 10) Number of Output Marginal Cost of Cost of Total Cost Students Product of Equipment Students Hired Hired Labour 100 100 100 140 100 100 180 300 100
 3. The economic student association at the University X is hiring students to make banners “I love economics” for the coming conference. Complete the following table and plot the production function and the cost function for producing banners. (Marks 10) Number of Output Marginal Cost of Cost of Total Cost Students Product of Equipment Students Hired Hired Labour 100 100 100 140 240 100 180 300 100
 4. If you are operating a business in a perfectly competitive market. You can sell as much as at the market price. Why can you not simply increase your profits by selling a highest quantity? (10 marks) Answer:
 4. If you are operating a business in a perfectly competitive market. You can sell as much as at the market price. Why can you not simply increase your profits by selling a highest quantity? (10 marks) Answer: 5. Your company operates in a perfectly competitive market. Your Manager told you that advertising can help you increase your sales in the short run. What kind of advertising campaign you will start for your product and how much gain is expected...
 15. Use the following figure for a firm in a perfectly competitive market. a What is the output that maximizes the firm's profit? b. At the profit-maximizing output, calculate total revenue and total cost. C. If the firm maximizes profit, how much profit does it earn? d. What will likely happen to market demand or market supply in the long run? e. What will likely happen to the market price in the long run? Price (s) d = P =...
 2. Consider the following exph (10 marks) Zoom ATC Ne The graph above shows the demand curve (D), marginal cost curve (MC), average cout exurve (AC), and marginal revenue curve (MR) for a monopolist. a) What is the profit maximizing quantity and price for the monopolist? Answer b) If this is a perfectly competitive market, what is the equilibrium quantity and price? Answer: c) What area represents the deadweight loss caused by the monopolist? Answer:
 V OIVERSITY 2. Consider the following graph (10 marks) ATC NER Q1 Q2 Q3 Q4 The graph above shows the demand curve (D), marginal cost curve (MC), average cost curve (AC), and marginal revenue curve (MR) for a monopolist. a) What is the profit maximizing quantity and price for the monopolist? Answer: b) If this is a perfectly competitive market, what is the equilibrium quantity and price? Answer: c) What area represents the deadweight loss caused by the monopolist? Answer:
Most questions answered within 3 hours.
-
Where is the error in this code sequence?
String s1 = "Hello";
String s2 = "ello";...
asked 11 months ago -
Financial data for Joel de Paris, Inc., for last year
follow:
Joel de Paris, Inc.
Balance...
asked 11 months ago -
Consider this reaction:
Al2(SO4)3 (aq)+ BaCl3
(aq) Al2Cl6 (aq)- +
3BaSO4(s) . What is the...
asked 11 months ago -
Suppose that Savneet is considering increasing her
recent random sample from 20 car rentals to 40...
asked 11 months ago -
Trucks arrive at an unloading terminal at an average rate of 120
per hour.
Trucks arrive...
asked 11 months ago -
Why are methanol and ethanol completely soluble in water while
octanol is not very little soluble....
asked 11 months ago -
A facilities manager at a university reads in a research report
that the mean amount of...
asked 11 months ago -
When the CuSO4 is rehydrated by adding water to the anhydrous
compound, is this an endothermic...
asked 11 months ago -
A ray of sunlight is passing from diamond into crown glass; the
angle of incidence is...
asked 11 months ago -
A block of mass 0.249 kg is placed on top of a light, vertical
spring of...
asked 11 months ago -
how do the kidneys compensate in the presences of acidosis
a) trigger hyperventilate
b) reserve acid...
asked 11 months ago -
Question 501 pts
The rental rate of capital to the firm increases. Which of the
following...
asked 11 months ago