IC Price Income Temp Lag-temp 0.386 0.27 78 41 56 0.374 0.282 79 56 63 0.393...
| IC | Price | Income | Temp | Lag-temp |
| 0.386 | 0.27 | 78 | 41 | 56 |
| 0.374 | 0.282 | 79 | 56 | 63 |
| 0.393 | 0.277 | 81 | 63 | 68 |
| 0.425 | 0.28 | 80 | 68 | 69 |
| 0.406 | 0.272 | 76 | 69 | 65 |
| 0.344 | 0.262 | 78 | 65 | 61 |
| 0.327 | 0.275 | 82 | 61 | 47 |
| 0.288 | 0.267 | 79 | 47 | 32 |
| 0.269 | 0.265 | 76 | 32 | 24 |
| 0.256 | 0.277 | 79 | 24 | 28 |
| 0.286 | 0.282 | 82 | 28 | 26 |
| 0.298 | 0.27 | 85 | 26 | 32 |
| 0.329 | 0.272 | 86 | 32 | 40 |
| 0.318 | 0.287 | 83 | 40 | 55 |
| 0.381 | 0.277 | 84 | 55 | 63 |
| 0.381 | 0.287 | 82 | 63 | 72 |
| 0.47 | 0.28 | 80 | 72 | 72 |
| 0.443 | 0.277 | 78 | 72 | 67 |
| 0.386 | 0.277 | 84 | 67 | 60 |
| 0.342 | 0.277 | 86 | 60 | 44 |
| 0.319 | 0.292 | 85 | 44 | 40 |
| 0.307 | 0.287 | 87 | 40 | 32 |
| 0.284 | 0.277 | 94 | 32 | 27 |
| 0.326 | 0.285 | 92 | 27 | 28 |
| 0.309 | 0.282 | 95 | 28 | 33 |
| 0.359 | 0.265 | 96 | 33 | 41 |
| 0.376 | 0.265 | 94 | 41 | 52 |
| 0.416 | 0.265 | 96 | 52 | 64 |
| 0.437 | 0.268 | 91 | 64 | 71 |
1. Define the first-order linear model.
a. E(Y) = β0 + β1X1 + β2X2 + β3X3 + β4X4
b. E(Y) = β1X1 + β2X2 + β3X3 + β4X4 + e
c. E(Y) = β0 + β1X1 + e
d. None of the above
2. Now fit the model to the data (i.e. run the regression). [I] What proportion of the total variation in ice cream consumption is explained by the regression? [II] What is the name of the statistic used to obtain this information?
a. About 92%; F statistic
b. About 85%; Mean square regression
c. About 1.89%; Coefficient of determination
d. About 85%; Coefficient of determination
e. None of the above
3. Define the null hypothesis for the regression model. What test of significance is used to test this hypothesis?
a. H0: β1 = β2 = β3 = β4 = 0; F
b. H0: β0 = β1 = β2 = β3 = β4 = 0; F
c. H0: β1 = β2 = β3 = β4 = 0; t
d. At least one of the coefficients is not equal to zero; F
e. None of the above
4. What is your conclusion, and the basis for your conclusion?
a. Reject H0. Regression is significant; p-value > 0.01
b. Do not reject H0. Regression is NOT significant; p-value < 0.01
c. Do not reject H0. Regression is significant; p-value < 0.01
d. Reject H0. Regression is significant; p-value < 0.01
e. None of the above
5. Upon what basis would this model be useful in predicting ice cream consumption?
a. If R-square is reasonably high and the t values are significant
b. If R-square is reasonable high
c. If F is significant and R-square is reasonably high
d. If F is significant, regardless of the size of R-square
e. If mean square regression is 100 percent
f. None of the above
6. If the model is statistically significant, then how much ice cream consumption is predicted if X1 = 0.35, X2 = 90, X3 = 50, and X4 = 50? To avoid rounding error, it is better to perform your calculations on spreadsheet.
a. 0.2580
b. 0.3429
c. 0.3578
d. None of the above
7. Which of the following is a measure of unexplained variation in the study? What is its value?
a. Standard error of the estimate; 0.0235
b. Mean square error; 0.0235
c. Sum of squares error; 0.0005
d. None of the above
8. Is there evidence that family income has an impact on the amount of ice cream consumed?
a. Yes. At the 0.05 level of significance
b. No. Some of the t values are not significant
c. No. Although the F statistic is significant, not all the t values are significant
d. Yes. The time variable is significant
e. None of the above
9. State the hypothesis to test if the price of ice cream contributes information in the prediction of ice cream consumption
a. H0: β1 = 0
b. H0: β2 = 0
c. H0: β3 = 0
d. H0: β1 = β2 = β3 = β4 = 0
e. None of the above
10. Is there evidence to suggest that price of ice cream has an impact on the amount of ice cream consumed?
a. Yes, at the 0.05 level of significance
b. No, the t value is not significant although it does seem that consumption goes down with price
c. No, the t value is not significant although it does seem that consumption increases with price
d. No, although the F statistic is significant
e. None of the above
Homework Answers
Using excel, running a linear regression for the given data,

![Book1 - Microsoft Exce Homensert Page Layout Formulas Data Review View t --] Data Analysis Clear E? -show Deta . A Hide Detai](http://img.homeworklib.com/questions/6f893240-78d5-11ea-a9bc-9bd0d3d8253d.png?x-oss-process=image/resize,w_560)
The output is obtained as:

1. The model has 4 predictors.Hence the first order linear model is given by:
b. E(Y) = β1X1 + β2X2 + β3X3 + β4X4 + e
where e = residual/ error
The fitted model is given by

2. The coefficient of determination of the fitted model gives the proportion of variation in the dependent variable that is explained by the explanatory variables.
From the regression output,

The name and value of the statistic used to obtain this information is d. About 85%; Coefficient of determination
3. The null hypothesis for regression model is given by:
a. H0: β1 = β2 = β3 = β4 = 0; F
4.
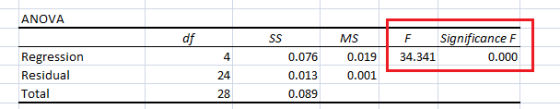
d. Reject H0: Regression is significant; p-value < 0.01
5. This model be useful in predicting ice cream consumption:
c. If F is significant and R-square is reasonably high
6. Substituting X1 = 0.35, X2 = 90, X3 = 50, and X4 = 50 in the fitted model:
E(Y) = 0.125 - 0.305 X1 + 0.002 X2 + 0.001 X3 + 0.003 X4
= -0.125 -0.305 (0.35) + 0.002 (90) + 0.001 (50) + 0.003 (50)
= 0.3429
7.The measure of Unexplained variation is:
a. Standard error of the estimate; 0.0235
8. To test whether family income has an impact on the amount of ice cream consumed using t test,

a. Yes. At the 0.05 level of significance.
(Since the p-value of the t test = 0.033 < 0.05)
9. The hypothesis to test if the price of ice cream contributes information in the prediction of ice cream consumption:
a. H0: β1 = 0
(Since the slope coefficient corresponding to the predictor 'Price' is β1.And slope measures the change in IC for a unit change in price)
10. To test whether price of ice cream has an impact on the amount of ice cream consumed,

b. No, the t value is not significant although it does seem that consumption goes down with price
(Since, the p-value corresponding to the test statistic 0.589 > 0.05,and the slope coefficient is negative (-0.305), as the price increases, the IC decreases.)
Add Answer to:
IC
Price
Income
Temp
Lag-temp
0.386
0.27
78
41
56
0.374
0.282
79
56
63
0.393...
Most questions answered within 3 hours.
-
Where is the error in this code sequence?
String s1 = "Hello";
String s2 = "ello";...
asked 11 months ago -
Financial data for Joel de Paris, Inc., for last year
follow:
Joel de Paris, Inc.
Balance...
asked 11 months ago -
Consider this reaction:
Al2(SO4)3 (aq)+ BaCl3
(aq) Al2Cl6 (aq)- +
3BaSO4(s) . What is the...
asked 11 months ago -
Suppose that Savneet is considering increasing her
recent random sample from 20 car rentals to 40...
asked 11 months ago -
Trucks arrive at an unloading terminal at an average rate of 120
per hour.
Trucks arrive...
asked 11 months ago -
Why are methanol and ethanol completely soluble in water while
octanol is not very little soluble....
asked 11 months ago -
A facilities manager at a university reads in a research report
that the mean amount of...
asked 11 months ago -
When the CuSO4 is rehydrated by adding water to the anhydrous
compound, is this an endothermic...
asked 11 months ago -
A ray of sunlight is passing from diamond into crown glass; the
angle of incidence is...
asked 11 months ago -
A block of mass 0.249 kg is placed on top of a light, vertical
spring of...
asked 11 months ago -
how do the kidneys compensate in the presences of acidosis
a) trigger hyperventilate
b) reserve acid...
asked 11 months ago -
Question 501 pts
The rental rate of capital to the firm increases. Which of the
following...
asked 11 months ago