
Homework Answers
Add Answer to:
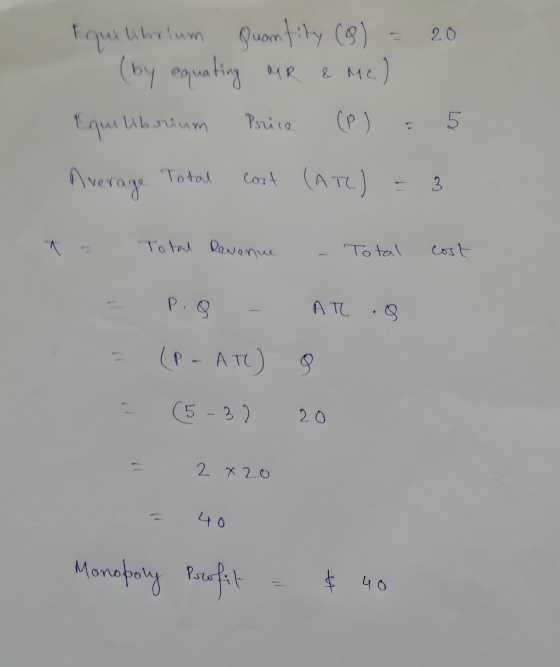
estimate the monopoly profits
Question 5 MC 10 20 25 30 Estimate the Monopoly's profits? $40...
The accompanying graph depicts a hypothetical monopoly. Follow instuctions 1-3 below to identify the monopoly's profits...
 The accompanying graph depicts a hypothetical monopoly. Follow instuctions 1-3 below to identify the monopoly's profits 1. Place point E at the monopoly's profit maximizing price and quantity 2. Move the average total cost (ATC) curve to a position that depicts the monopoly earning a positive profit 3. Place the area labeled Profit in the area of the graph that represents the monopoly's profit. 10 MC Profit ATC MR 0 1 2 3 45 6 7 89 10 Quantity (millons...
18. (Figure: Increasing Costs) Price $40 Firm 1 30 MC AC 20 18 15 10 5...
 18. (Figure: Increasing Costs) Price $40 Firm 1 30 MC AC 20 18 15 10 5 10 15 20 25 30 35 40 45 50 Quantity Firm 2 Price $40 30 MC AC 20 18 15 10 2 4 6 8 10 12 14 16 18 20 Quantity Refer to the figure. If an industry consists of two firms, Firm l and Firm 2, as shown in the diagram, the industry's quantity supplied at a price of S15 is industry's...
QUESTION 15 Figure 5-5 11 Price - Demand 5 10 15 20 25 30 35 40...
 QUESTION 15 Figure 5-5 11 Price - Demand 5 10 15 20 25 30 35 40 45 50 55 Quantity Refer to Figure 5-5. Using the midpoint method, demand is unit elastic between prices of O a. $20 and $40. b.$50 and $70 c. $40 and $60 d. $40 and $50.
Question 5 Exhibit 9-2 Demand and cost information for a monopoly TC 40 10 10 30...
 Question 5 Exhibit 9-2 Demand and cost information for a monopoly TC 40 10 10 30 15 20 25 13 10 40 60 The marginal revenue of the second unit of output in Exhibit 9-2 is: 40. O 60. O 20. 30. 10. * Previous No new data to save. La Question 8 2 pt Which antitrust act prohibits price fixing and other conspiracies and combinations that restrain trade and attempts to monopolize? Robinson-Patman Act of 1936. Sherman Act of...
QUESTION 9 Volts 107 5 10 15 20 25 30 35 40 45 50 (ms) -10...
 QUESTION 9 Volts 107 5 10 15 20 25 30 35 40 45 50 (ms) -10 -20% Given the above graph. Which general sinusoidal equation describes the voltage 20 sin (314.161) 40 sin (125.661) 20 sin (125.66t) 20 cos (314.16t)
MR Demand 10 20 30 40 50 60 70 80 Duantity Refer to Figure 15-20. The...
 MR Demand 10 20 30 40 50 60 70 80 Duantity Refer to Figure 15-20. The deadweight loss caused by a profit-maximizing monopoly amounts to a. $900. b. $225. c. $1,350. d. $450 Price MC 4+ F + 1 + 2 + 4 Demand 10 11 12 3 5 6 7 8 9 Quantity Refer to Figure 15-11. Which area represents the deadweight loss from monopoly? a. H b. A+B+C+D+F+I+J+H O c. S+H d. J Price MC Demand iMR: 10...
The demand function for a monopoly shown in the graph at right is: Demand and Marginal...
 The demand function for a monopoly shown in the graph at right is: Demand and Marginal Revenue 120 110 100 p 80-2Q. Use the line drawing tool to draw the marginal revenue curve associated with the monopoly's demand curve. Label this line 'MR'. 90- 80 70- Carefully follow the instructions above, and only draw the required object. 60 50- 40 30- 20- 10- 0- 0 5 10 15 20 25 30 35 40 45 50 55 60 Quantity
Classes Frequency Frequency 10-14 20 15-19 40 20-24 25 25-29 10 30-34 5 Question:...
Classes Frequency Frequency 10-14 20 15-19 40 20-24 25 25-29 10 30-34 5 Question: I need a histogram chart, bar chart, pie chart,
Willy's widgets, a monopoly, faces the following demand schedule (sales of widgets per month): Price $20 30 40 50 60 70 80 90 100 Quantity 40 35 30 25 20 15 10 5 0 Calculate marginal revenue over each interval in the schedule (for example, between Q
Willy's widgets, a monopoly, faces the following demand schedule (sales of widgets per month): Price $20 30 40 50 60 70 80 90 100 Quantity 40 35 30 25 20 15 10 5 0 Calculate marginal revenue over each interval in the schedule (for example, between Q = 40 and Q=35). Recall that the revenue is the added revenue from an additional unit of production/sales and assume MR is constant within each interval. If marginal cost is constant at $20...
Question 10 1 pts $. pc MC 50 - AC 40 1 AVC 30 14 1...
 Question 10 1 pts $. pc MC 50 - AC 40 1 AVC 30 14 1 9 10 23 25 33 The figure above shows the short-run cost curves for a firm in a perfectly competitive market. The firm should shut down production in the short run if price is below $30 price is below $40. price is below $50. price is above AC
 The accompanying graph depicts a hypothetical monopoly. Follow instuctions 1-3 below to identify the monopoly's profits 1. Place point E at the monopoly's profit maximizing price and quantity 2. Move the average total cost (ATC) curve to a position that depicts the monopoly earning a positive profit 3. Place the area labeled Profit in the area of the graph that represents the monopoly's profit. 10 MC Profit ATC MR 0 1 2 3 45 6 7 89 10 Quantity (millons...
 18. (Figure: Increasing Costs) Price $40 Firm 1 30 MC AC 20 18 15 10 5 10 15 20 25 30 35 40 45 50 Quantity Firm 2 Price $40 30 MC AC 20 18 15 10 2 4 6 8 10 12 14 16 18 20 Quantity Refer to the figure. If an industry consists of two firms, Firm l and Firm 2, as shown in the diagram, the industry's quantity supplied at a price of S15 is industry's...
 QUESTION 15 Figure 5-5 11 Price - Demand 5 10 15 20 25 30 35 40 45 50 55 Quantity Refer to Figure 5-5. Using the midpoint method, demand is unit elastic between prices of O a. $20 and $40. b.$50 and $70 c. $40 and $60 d. $40 and $50.
 Question 5 Exhibit 9-2 Demand and cost information for a monopoly TC 40 10 10 30 15 20 25 13 10 40 60 The marginal revenue of the second unit of output in Exhibit 9-2 is: 40. O 60. O 20. 30. 10. * Previous No new data to save. La Question 8 2 pt Which antitrust act prohibits price fixing and other conspiracies and combinations that restrain trade and attempts to monopolize? Robinson-Patman Act of 1936. Sherman Act of...
 QUESTION 9 Volts 107 5 10 15 20 25 30 35 40 45 50 (ms) -10 -20% Given the above graph. Which general sinusoidal equation describes the voltage 20 sin (314.161) 40 sin (125.661) 20 sin (125.66t) 20 cos (314.16t)
 MR Demand 10 20 30 40 50 60 70 80 Duantity Refer to Figure 15-20. The deadweight loss caused by a profit-maximizing monopoly amounts to a. $900. b. $225. c. $1,350. d. $450 Price MC 4+ F + 1 + 2 + 4 Demand 10 11 12 3 5 6 7 8 9 Quantity Refer to Figure 15-11. Which area represents the deadweight loss from monopoly? a. H b. A+B+C+D+F+I+J+H O c. S+H d. J Price MC Demand iMR: 10...
 The demand function for a monopoly shown in the graph at right is: Demand and Marginal Revenue 120 110 100 p 80-2Q. Use the line drawing tool to draw the marginal revenue curve associated with the monopoly's demand curve. Label this line 'MR'. 90- 80 70- Carefully follow the instructions above, and only draw the required object. 60 50- 40 30- 20- 10- 0- 0 5 10 15 20 25 30 35 40 45 50 55 60 Quantity
 Question 10 1 pts $. pc MC 50 - AC 40 1 AVC 30 14 1 9 10 23 25 33 The figure above shows the short-run cost curves for a firm in a perfectly competitive market. The firm should shut down production in the short run if price is below $30 price is below $40. price is below $50. price is above AC
Most questions answered within 3 hours.
-
Where is the error in this code sequence?
String s1 = "Hello";
String s2 = "ello";...
asked 10 months ago -
Financial data for Joel de Paris, Inc., for last year
follow:
Joel de Paris, Inc.
Balance...
asked 10 months ago -
Consider this reaction:
Al2(SO4)3 (aq)+ BaCl3
(aq) Al2Cl6 (aq)- +
3BaSO4(s) . What is the...
asked 10 months ago -
Suppose that Savneet is considering increasing her
recent random sample from 20 car rentals to 40...
asked 10 months ago -
Trucks arrive at an unloading terminal at an average rate of 120
per hour.
Trucks arrive...
asked 10 months ago -
Why are methanol and ethanol completely soluble in water while
octanol is not very little soluble....
asked 10 months ago -
A facilities manager at a university reads in a research report
that the mean amount of...
asked 10 months ago -
When the CuSO4 is rehydrated by adding water to the anhydrous
compound, is this an endothermic...
asked 10 months ago -
A ray of sunlight is passing from diamond into crown glass; the
angle of incidence is...
asked 10 months ago -
A block of mass 0.249 kg is placed on top of a light, vertical
spring of...
asked 10 months ago -
how do the kidneys compensate in the presences of acidosis
a) trigger hyperventilate
b) reserve acid...
asked 10 months ago -
Question 501 pts
The rental rate of capital to the firm increases. Which of the
following...
asked 10 months ago