Common-size financial statements are often used by auditors in a process called “analytical procedures” or “analytical review.” Unusual relationships or patterns can be identified because of the percentages—these would be harder to see if the amounts were just kept as dollars. You will be looking for percentages that seem very unstable over the times periods (the percentages jump around too much).
What are some of the unusual relationships you see? Please
identify and discuss at least two unusual relationships. Please
attach your common-income statement.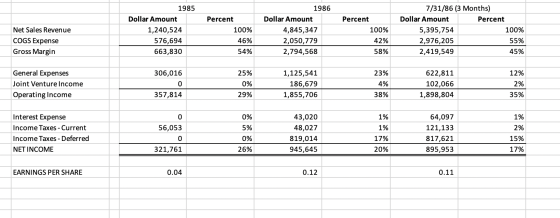
Homework Answers
| 1985 | 1986 | 7/31/86 3 months | |
| Net sales revenue | 12,40,524 | 48,45,347 | 53,95,754 |
| COGS expense | 5,76,694 | 20,50,779 | 29,76,205 |
| Gross margin | 6,63,830 | 27,94,568 | 24,19,549 |
| General expense | 3,06,016 | 11,25,541 | 6,22,811 |
| Joint venture income | 0 | 1,86,679 | 1,02,066 |
| Operating income | 3,57,814 | 18,55,706 | 18,98,804 |
| Interest expense | 0 | 43,020 | 64,097 |
| Income taxes - current | 56,053 | 48,027 | 1,21,133 |
| Income taxes - deferred | 0 | 8,19,014 | 8,17,621 |
| Net income | 3,01,761 | 9,45,645 | 8,95,953 |
| Earning per share | 0.04 | 0.12 | 0.11 |
| Common size income statement | 1985 | 1986 | 7/31/86 3 months |
| Net sales revenue | 100% | 100% | 100% |
| COGS expense | 46% | 42% | 55% |
| Gross margin | 54% | 58% | 45% |
| General expense | 25% | 23% | 12% |
| Joint venture income | 0% | 4% | 2% |
| Operating income | 29% | 38% | 35% |
| Interest expense | 0% | 1% | 1% |
| Income taxes - current | 5% | 1% | 2% |
| Income taxes - deferred | 0% | 17% | 15% |
| Net income | 24% | 20% | 17% |

| 1) COGS expenses are of 55% of total sales in quarter ended July 86 where as COGS expenses in 1985 and 1986 period is much lesser. Resulting in gross margin variations. |
| 2) General expense in 7/31/1986 3 months period is 12% which is lesser than other two period i.e. 1986 and 1985 |
Add Answer to:
Common-size financial statements are often used by auditors in a
process called “analytical procedures” or “analytical...
Analyze the common size income statements below, for West Company. How has the company’s gross margin...
Analyze the common size income statements below, for West Company. How has the company’s gross margin evolved from 2016 to 2017 and what are possible reasons for such evolution? How has the company’s operating income evolved from 2016 to 2017 and what are possible reasons for such evolution? Elaborate on the sustainability of recent changes in operating expenses. How has the company’ s interest expense impacted its net income from 2016 to 2017 and what are possible reasons for such...
A main element of financial statement analysis is the use of common-size financial statements, also called...
 A main element of financial statement analysis is the use of common-size financial statements, also called "vertical analysis." A common-size balance sheet divides each account's value by the value of total assets, while a common-size income statement divides each entry by net sales revenue Common-size balance sheets immediately show how a firm's assets, liabilities, and equity are distributed. Common-size income statements give a quick snapshot of how various expenses and types of income relate to sales revenue. The following common-size...
(Analyzing common-size financial statements) Use the common-size financial statements found here: to respond to your boss'...
 (Analyzing common-size financial statements) Use the common-size financial statements found here: to respond to your boss' request that you write up your assessment of the firm's financial condition. Specifically, write up a brief narrative that responds to the following questions: a. How much cash does Patterson have on hand relative to its total assets? b. What proportion of Patterson's assets has the firm financed using short-term debt? Long-term debt? c. What percent of Patterson's revenues does the firm have left...
(Analyzing common-size financial statements) Use the common-size financial statements found here: LOADING... to respond to your...
(Analyzing common-size financial statements) Use the common-size financial statements found here: LOADING... to respond to your boss' request that you write up your assessment of the firm's financial condition. Specifically, write up a brief narrative that responds to the following questions: a. How much cash does Patterson have on hand relative to its total assets? b. What proportion of Patterson's assets has the firm financed using short-term debt? Long-term debt? c. What percent of Patterson's revenues does the firm have...
QUESTION 32 Analytical procedures are evaluations of financial information made by a study of plausible relationships...
QUESTION 32 Analytical procedures are evaluations of financial information made by a study of plausible relationships among financial and nonfinancial data. Understanding and evaluating such relationships is essential to the audit process. Each of the following represents a financial ratio that the auditor calculated during the prior year's audit. For each ratio, calculate the current year's ratio from the financial statements. Sales represent net credit sales. The total assets, receivables, and inventory balances at December 31, year 2 were the...
Detail and Analyze the operations below? COMMON-SIZE STATEMENT OF OPERATIONS (in percentages) 2016 2015 Operating Revenues:...
Detail and Analyze the operations below? COMMON-SIZE STATEMENT OF OPERATIONS (in percentages) 2016 2015 Operating Revenues: Software Licenses 36% 39.1% Maintenance and Support 56% 53.7% Professional services 8.1% 7.2% Total Revenues 100% 100% Cost of revenues Software licenses 9.3% 7.9% Maintenance and support 4.6% 4.8% Professional services 5% 4.5% Total cost of revenues 19% 17.2% Gross profit 81% 82.8% Operating expenses Sales and marketing 35% 33.9% General and administrative 21% 20.1% Research and development 7.6% 8.3% Total operating expenses 63.6%...
Given the most recent financial statements for Microsoft (FY2019). Sales for FY2020 are expected to grow...
 Given the most recent financial statements for Microsoft (FY2019). Sales for FY2020 are expected to grow by 4 percent. The following assumption must hold in the pro forma financial statements. The tax rate (percentage) and the dividend payout ratio (percentage) will remain constant. COGS, SGA, Depreciation, Interest Expense, Cash, Account Receivable, Inventory, Other Current Assets, and Net Fixed Asset increase spontaneously with sales. If the firm is operating at full capacity and no new debt or equity are issued, calculate...
Using the following balance sheet, prepare and analyze the common size balance sheet: Assets &nb...
Using the following balance sheet, prepare and analyze the common size balance sheet: Assets Liabilities and stockholders’ equity Current assets Current liabilities Cash 4 Accounts payable 28 Short term investments 9 Current portion of long term debt 12 Accounts receivable 32 Total current liabilities 40 Inventory 41 Prepaid expenses 2 Long term liabilities Deferred taxes, current 7 Long term debt 48 Total current assets 95 Total liabilities 88 Long term assets Stockholders equity Property & equipment 53 Common stock...
Common-Sized Income Statement Revenue and expense data for the current calendar year for Sorenson Electronics Company...
Common-Sized Income Statement Revenue and expense data for the current calendar year for Sorenson Electronics Company and for the electronics industry are as follows. Sorenson Electronics Company data are expressed in dollars. The electronics industry averages are expressed in percentages. Sorenson Electronics Company Electronics Industry Average Sales $2,360,000 100 % Cost of goods sold (1,298,000) (61) Gross profit $1,062,000 39 % Selling expenses $(637,200) (17) % Administrative expenses (259,600) (16) Total operating expenses $(896,800) (33) % Operating income $165,200 6...
Return to course È Business Course Common-Size Income Statements Consider the following income statement data from...
 Return to course È Business Course Common-Size Income Statements Consider the following income statement data from the Ross Company: 2013 2012 Sales revenue $545,000 $460,000 Cost of goods sold 336,000 279,000 Selling expenses 105,000 99,000 Administrative expenses 70,000 64,000 Income tax expense 17,800 15,400 Prepare common-size income statements for each year. Note: Round answers to one decimal place (ex: 0.2345 = 23.5%). ROSS COMPANY Common-Size Income Statements (Percent of Sales Revenue) 2013 2012 Sales Revenue 100% 100% Cost of Goods...
 A main element of financial statement analysis is the use of common-size financial statements, also called "vertical analysis." A common-size balance sheet divides each account's value by the value of total assets, while a common-size income statement divides each entry by net sales revenue Common-size balance sheets immediately show how a firm's assets, liabilities, and equity are distributed. Common-size income statements give a quick snapshot of how various expenses and types of income relate to sales revenue. The following common-size...
 (Analyzing common-size financial statements) Use the common-size financial statements found here: to respond to your boss' request that you write up your assessment of the firm's financial condition. Specifically, write up a brief narrative that responds to the following questions: a. How much cash does Patterson have on hand relative to its total assets? b. What proportion of Patterson's assets has the firm financed using short-term debt? Long-term debt? c. What percent of Patterson's revenues does the firm have left...
 Given the most recent financial statements for Microsoft (FY2019). Sales for FY2020 are expected to grow by 4 percent. The following assumption must hold in the pro forma financial statements. The tax rate (percentage) and the dividend payout ratio (percentage) will remain constant. COGS, SGA, Depreciation, Interest Expense, Cash, Account Receivable, Inventory, Other Current Assets, and Net Fixed Asset increase spontaneously with sales. If the firm is operating at full capacity and no new debt or equity are issued, calculate...
 Return to course È Business Course Common-Size Income Statements Consider the following income statement data from the Ross Company: 2013 2012 Sales revenue $545,000 $460,000 Cost of goods sold 336,000 279,000 Selling expenses 105,000 99,000 Administrative expenses 70,000 64,000 Income tax expense 17,800 15,400 Prepare common-size income statements for each year. Note: Round answers to one decimal place (ex: 0.2345 = 23.5%). ROSS COMPANY Common-Size Income Statements (Percent of Sales Revenue) 2013 2012 Sales Revenue 100% 100% Cost of Goods...
Most questions answered within 3 hours.
-
Where is the error in this code sequence?
String s1 = "Hello";
String s2 = "ello";...
asked 10 months ago -
Financial data for Joel de Paris, Inc., for last year
follow:
Joel de Paris, Inc.
Balance...
asked 10 months ago -
Consider this reaction:
Al2(SO4)3 (aq)+ BaCl3
(aq) Al2Cl6 (aq)- +
3BaSO4(s) . What is the...
asked 10 months ago -
Suppose that Savneet is considering increasing her
recent random sample from 20 car rentals to 40...
asked 10 months ago -
Trucks arrive at an unloading terminal at an average rate of 120
per hour.
Trucks arrive...
asked 10 months ago -
Why are methanol and ethanol completely soluble in water while
octanol is not very little soluble....
asked 10 months ago -
A facilities manager at a university reads in a research report
that the mean amount of...
asked 10 months ago -
When the CuSO4 is rehydrated by adding water to the anhydrous
compound, is this an endothermic...
asked 10 months ago -
A ray of sunlight is passing from diamond into crown glass; the
angle of incidence is...
asked 10 months ago -
A block of mass 0.249 kg is placed on top of a light, vertical
spring of...
asked 10 months ago -
how do the kidneys compensate in the presences of acidosis
a) trigger hyperventilate
b) reserve acid...
asked 10 months ago -
Question 501 pts
The rental rate of capital to the firm increases. Which of the
following...
asked 10 months ago