Check Figures:
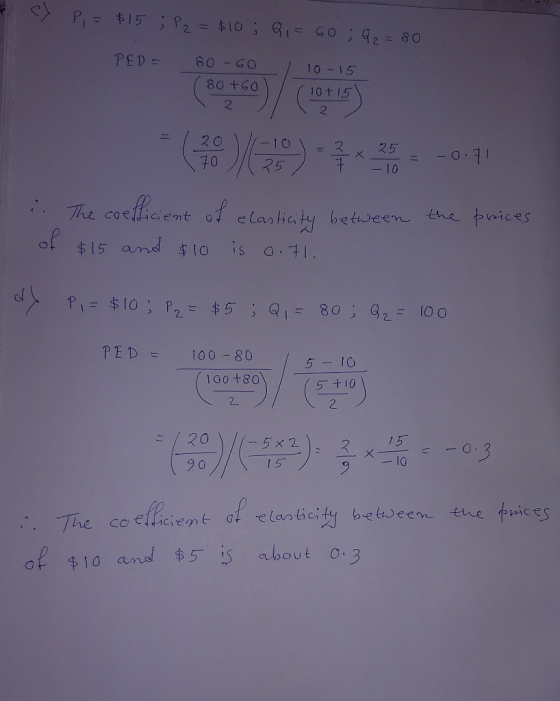
The Coefficient of Elasticity between the prices of $25 and $20 should be about 3.0
The Coefficient of Elasticity between the prices of $10 and $5 should be about .3.

Homework Answers

Add Answer to:
Check Figures:
The Coefficient of Elasticity between the prices of $25 and $20
should be about...
Check my work 00 The data below represent a demand schedule. Product Price 2 points $40...
 Check my work 00 The data below represent a demand schedule. Product Price 2 points $40 35 Quantity Demanded 5 10 15 20 25 30 eBook 25 20 Print References Determine the price elasticity demand between each of the following prices: Instructions: Round your answers to 2 decimal places. Enter your answers as positive values (absolute values). a. Between P - $40 and P2 - $35, Ed- b. Between P = $35 and P2 = $30. Ed= c. Between A-$30...
Quantity Demanded Price $25 $15 Complete the following table by calculating the price elasticity of demand...
 Quantity Demanded Price $25 $15 Complete the following table by calculating the price elasticity of demand between specified points and indicating whether inelastic, or unit elastic. (Hint: Use the midpoints formula.) Interval From P - $20 to P - $25 From P - $20 to P - $15 Price Elasticity of Demand -1.40 Elastic, Inelastic, or Unit Elastic Elastic Elastic Inelastic From P - $15 to P - $20 From P - $15 to P - $10 Inelastic
Check my work The data below represent a demand schedule. Quantity Demanded Product Price $50 Determine...
 Check my work The data below represent a demand schedule. Quantity Demanded Product Price $50 Determine the price elasticity of demand between each of the following prices: Instructions: Round your answers to 2 decimal places. Enter your answers as positive values absolute values). a. Between P1 = $50 and P2 = $40, Ed=D b. Between P1 = $40 and P2 = $30, Ed=0 C. Between P1 = $30 and P2 = $20, Ed-D d. Between P1 = $20 and P2...
The data below represent a demand schedule. Quantity Demanded Product Price $50 10 15 20 20...
 The data below represent a demand schedule. Quantity Demanded Product Price $50 10 15 20 20 1025 Determine the price elasticity of demand between each of the following prices: Instructions: Round your answers to 2 decimal places. Enter your answers as pos a. Between P1 = $50 and P2 = $40. Ed= b. Between P1 = $40 and P2 = $30, Ed= c. Between P1 = $30 and P2 = $20, Ed= d. Between P1 = $20 and P2 =...
INCUELASTICITUR DEVAID LAIDUU Elasticity Category Elasticity Coefficient Example Graphical Representation Chan: Total Relationship between Price and...
 INCUELASTICITUR DEVAID LAIDUU Elasticity Category Elasticity Coefficient Example Graphical Representation Chan: Total Relationship between Price and Quantity Demanded (OD Elastic Demand P1=$9 P2=$7 Q1=15 Q2=25 Inelastic Demand P1=$5 P2=$3 Q1=35 Q2=45 Unit Elastic Demand P1=$7 P2=$5 Q1=25 Q2=35 Perfectly Elastic Demand P1=P2=$5 Qis indefinitely large or small Perfectly Inelastic Demand P1=$7 P2=$3 Q1=Q2=35
3. Problem-solving exercises: (a) Use the arc-approximation formula to calculate the price-elasticity of demand coefficient of...
3. Problem-solving exercises: (a) Use the arc-approximation formula to calculate the price-elasticity of demand coefficient of a firm's product demand between the (quantity, price) points of (12, $20) and (18, $16). (b) Calculate the cross-price elasticity of demand coefficient of a firm's product X, given that a 10% increase in the price of its close substitute, product Y, causes the quantity demand of product X to increase by 6%. c) Calculate the income-elasticity of demand coefficient for a product for...
apter 6 Homework Saved 1 The data below represent a demand schedule. Product Price $50 40...
 apter 6 Homework Saved 1 The data below represent a demand schedule. Product Price $50 40 Quantity Demanded 5 nts eBook 30 20 15 25 35 45 Print 10 ferences Determine the price elasticity of demand between each of the following prices: Instructions: Round your answers to 2 decimal places. Enter your answers as positive values (absolute values), a. Between A = $50 and P2 = $40. Ed- b. Between P,= $40 and P2 - $30. E- Prev 1 of...
1) Solve for price elasticity of demand (E.) and price elasticity of supply (E.) between each...
 1) Solve for price elasticity of demand (E.) and price elasticity of supply (E.) between each pair of prices ($8 and S7, and $7 and S6) using the Mid-point formula and determine the total revenue that could be earned at each price. Show your work! Es Quantity Supplied Product Price Quantity Demanded Total Revenue Ed 17,000 S8 7,000 13,000 22,000 11,000 25,000 2) Describe the relationships involved in the total revenue test and apply it to this data.
12. Study Questions #12 12. Study Questions #12 Opponents of increasing the tax on gasoline argue...
12. Study Questions #12 12. Study Questions #12 Opponents of increasing the tax on gasoline argue that the big oil companies just pass the tax along to the consumers. Do you agree or disagree? a. Agree because the demand for gasoline is less elastic than the supply, thus sellers can just pass the tax along to the consumers. b. Disagree because the demand for gasoline slopes downward and the supply curve slopes upward, thus sellers cannot raise the price by...
The price elasticity of demand will always be a negative number because: demand is determined by...
 The price elasticity of demand will always be a negative number because: demand is determined by consumers. producers and consumers like different prices. price and quantity demanded move in opposite directions. price and quantity demanded move in the same direction The income elasticity of demand for a good describes how much: the quantity supplied changes in response to a change in producers' incomes the quantity supplied changes in response to a change in consumers' incomes. the quantity demanded changes in...
 Check my work 00 The data below represent a demand schedule. Product Price 2 points $40 35 Quantity Demanded 5 10 15 20 25 30 eBook 25 20 Print References Determine the price elasticity demand between each of the following prices: Instructions: Round your answers to 2 decimal places. Enter your answers as positive values (absolute values). a. Between P - $40 and P2 - $35, Ed- b. Between P = $35 and P2 = $30. Ed= c. Between A-$30...
 Quantity Demanded Price $25 $15 Complete the following table by calculating the price elasticity of demand between specified points and indicating whether inelastic, or unit elastic. (Hint: Use the midpoints formula.) Interval From P - $20 to P - $25 From P - $20 to P - $15 Price Elasticity of Demand -1.40 Elastic, Inelastic, or Unit Elastic Elastic Elastic Inelastic From P - $15 to P - $20 From P - $15 to P - $10 Inelastic
 Check my work The data below represent a demand schedule. Quantity Demanded Product Price $50 Determine the price elasticity of demand between each of the following prices: Instructions: Round your answers to 2 decimal places. Enter your answers as positive values absolute values). a. Between P1 = $50 and P2 = $40, Ed=D b. Between P1 = $40 and P2 = $30, Ed=0 C. Between P1 = $30 and P2 = $20, Ed-D d. Between P1 = $20 and P2...
 The data below represent a demand schedule. Quantity Demanded Product Price $50 10 15 20 20 1025 Determine the price elasticity of demand between each of the following prices: Instructions: Round your answers to 2 decimal places. Enter your answers as pos a. Between P1 = $50 and P2 = $40. Ed= b. Between P1 = $40 and P2 = $30, Ed= c. Between P1 = $30 and P2 = $20, Ed= d. Between P1 = $20 and P2 =...
 INCUELASTICITUR DEVAID LAIDUU Elasticity Category Elasticity Coefficient Example Graphical Representation Chan: Total Relationship between Price and Quantity Demanded (OD Elastic Demand P1=$9 P2=$7 Q1=15 Q2=25 Inelastic Demand P1=$5 P2=$3 Q1=35 Q2=45 Unit Elastic Demand P1=$7 P2=$5 Q1=25 Q2=35 Perfectly Elastic Demand P1=P2=$5 Qis indefinitely large or small Perfectly Inelastic Demand P1=$7 P2=$3 Q1=Q2=35
 apter 6 Homework Saved 1 The data below represent a demand schedule. Product Price $50 40 Quantity Demanded 5 nts eBook 30 20 15 25 35 45 Print 10 ferences Determine the price elasticity of demand between each of the following prices: Instructions: Round your answers to 2 decimal places. Enter your answers as positive values (absolute values), a. Between A = $50 and P2 = $40. Ed- b. Between P,= $40 and P2 - $30. E- Prev 1 of...
 1) Solve for price elasticity of demand (E.) and price elasticity of supply (E.) between each pair of prices ($8 and S7, and $7 and S6) using the Mid-point formula and determine the total revenue that could be earned at each price. Show your work! Es Quantity Supplied Product Price Quantity Demanded Total Revenue Ed 17,000 S8 7,000 13,000 22,000 11,000 25,000 2) Describe the relationships involved in the total revenue test and apply it to this data.
 The price elasticity of demand will always be a negative number because: demand is determined by consumers. producers and consumers like different prices. price and quantity demanded move in opposite directions. price and quantity demanded move in the same direction The income elasticity of demand for a good describes how much: the quantity supplied changes in response to a change in producers' incomes the quantity supplied changes in response to a change in consumers' incomes. the quantity demanded changes in...
Most questions answered within 3 hours.
-
Where is the error in this code sequence?
String s1 = "Hello";
String s2 = "ello";...
asked 11 months ago -
Financial data for Joel de Paris, Inc., for last year
follow:
Joel de Paris, Inc.
Balance...
asked 11 months ago -
Consider this reaction:
Al2(SO4)3 (aq)+ BaCl3
(aq) Al2Cl6 (aq)- +
3BaSO4(s) . What is the...
asked 11 months ago -
Suppose that Savneet is considering increasing her
recent random sample from 20 car rentals to 40...
asked 11 months ago -
Trucks arrive at an unloading terminal at an average rate of 120
per hour.
Trucks arrive...
asked 11 months ago -
Why are methanol and ethanol completely soluble in water while
octanol is not very little soluble....
asked 11 months ago -
A facilities manager at a university reads in a research report
that the mean amount of...
asked 11 months ago -
When the CuSO4 is rehydrated by adding water to the anhydrous
compound, is this an endothermic...
asked 11 months ago -
A ray of sunlight is passing from diamond into crown glass; the
angle of incidence is...
asked 11 months ago -
A block of mass 0.249 kg is placed on top of a light, vertical
spring of...
asked 11 months ago -
how do the kidneys compensate in the presences of acidosis
a) trigger hyperventilate
b) reserve acid...
asked 11 months ago -
Question 501 pts
The rental rate of capital to the firm increases. Which of the
following...
asked 11 months ago