
Homework Answers
a)
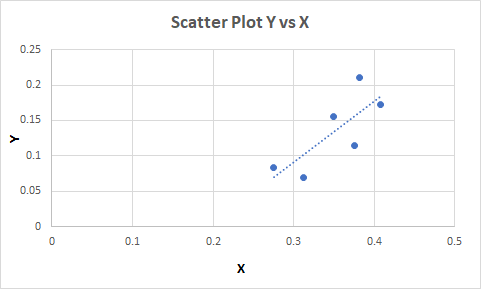
A scatter plot (also called a scatterplot, scatter graph, scatter chart, scattergram, or scatter diagram) is a type of plot or mathematical diagram using Cartesian coordinates to display values for typically two variables for a set of data. A relationship is linear when the points on a scatterplot follow a somewhat straight line pattern. In the above diagram we can see the data points follow a somewhat straight line pattern.
The scatterplot shows that X and Y are positively correlated.
b) Y=mX+b
m=Slope= (Y2-Y1/X2-X1) or can be calculated using slope function in excel.
b= intercept (can be calculated using intercept function in excel.)
Linear Equation is : Y= -0.16 + 0.85X

C) The equation between two variables gives a straight line when plotted. Hence, it is good.
D) Analysis of variance or ANOVA can be used to compare the means between two or more groups of values. We can test the null hypothesis that the means of each sample are equal against the alternative that not all the sample means are the same.

E)
R-squared is a statistical measure of how close the data are to the fitted regression line. It is also known as the coefficient of determination, or the coefficient of multiple determination for multiple regression.
R-Square can be calculated using the below formula or by using Excel (Data Analysis - Regression- Specify X and Y values).
![R Squared Formula = r2 n (Σ Xy) - (Σκ)(Σy) V[nΣx - (Σκ?][nsy - (Σy] Γ =](http://img.homeworklib.com/questions/d1054cd0-792a-11ea-8d09-13fd9be1d6a1.png?x-oss-process=image/resize,w_560)
R-squared = Explained variation / Total variation

R-squared is always between 0 and 100%:
- 0% indicates that the model explains none of the variability of the response data around its mean.
- 100% indicates that the model explains all the variability of the response data around its mean.
In general, the higher the R-squared, the better the model fits your data.
0.60 R square value indicates that means that 60 percent of the variation in the Y data is due to variation in the X data.
Add Answer to:
Below is a small data set showing observations on two variables X and Y. X Y...
A set of bivariate data consists of these measurements on two variables, x and y: 2...
 A set of bivariate data consists of these measurements on two variables, x and y: 2 4 4 6 8 4 7 6 (a) Make a scatterplot. Comment on the form, direction, and strength of the relationship. The relationship appears to be linear, positive, and fairly weak. The relationship appears to be linear, negative, and fairly strong. The relationship appears to be linear, positive, and fairly strong. The relationship appears to be linear, negative, and fairly weak. ● The relationship...
Consider the following data for two variables, x and y.
 Consider the following data for two variables, x and y. a. Choose the correct scatter diagram with x and y. The correct scatter diagram is - _______ . Does there appear to be a linear relationship between x and y? Explain. The scatter diagram- Select your answer - some evidence of a possible linear relationship. b. Develop the estimated regression equation relating x and y. Save "predicted" and "residuals" (to 4 decimals). c. Choose the correct scatter diagram or the residuals versus y tor the estimated...
Using the data file provided with both variables, x and y, answer the following questions using...
Using the data file provided with both variables, x and y, answer the following questions using Excel*: 1.Create a scatterplot with the data. Comment on direction, form, strength, outliers and/or other significant findings. 2.Use the linear model to fit a line to the data and determine the equation ỹ = b0 + b1x and Interpret b0and b1. 3.Calculate the coefficient of correlation. Discuss the strength of correlation between the explanatory and response variables. 4.Predict the value for ỹ when you...
3. Consider the following data for two variables, x and y. 4 5 4 6 4...
 3. Consider the following data for two variables, x and y. 4 5 4 6 4 6 9 5 11 a. Does there appear to be a linear relationship between x and y? Explain. b. Develop the estimated regression equation relating x and y. c. Plot the standardized residuals versus g for the estimated regression equation developed in part (b). Do the model assumptions appear to be satisfied? Explain. d. Perform a logarithmic transformation on the dependent variable y. Develop...
Homework 4 Use the hand span data that we collected in class for homework Suppose you...
Homework 4 Use the hand span data that we collected in class for homework Suppose you want to buy someone a pair of love, but you do not know their love size. Usually, we do have a pretty good idea of the person's height. Let' asume that the right hand span is a rood indicator of the love size. So let find the best predictor of right hand span be on the person's height. Once we can predict the right...
The data shown below for the dependent variable, y, and the independent variable, x, have been...
 The data shown below for the dependent variable, y, and the independent variable, x, have been collected using simple random sampling. X 10 15 11 19 18 17 5 17 18 y 9070 30 8020 30 5060 40 40 a. Develop a simple linear regression equation for these data. b. Calculate the sum of squared residuals, the total sum of squares, and the coefficient of determination c. Calculate the standard error of the estimate. d. Calculate the standard error for...
The data shown below for the dependent variable, y, and the independent variable, x, have been ...
 The data shown below for the dependent variable, y, and the
independent variable, x, have been collected using simple random
sampling.
x y
11 100
13 80
15 80
12 90
20 60
17 60
15 70
13 90
15 90
17 80
a. Complete the linear regression equation below Round to one decimal place as needed.) b. Calculate the sum of the squared residuals. SSE-L (Round to the nearest whole number as needed) What is the total sum of...
The data shown below for the dependent variable, y, and the
independent variable, x, have been collected using simple random
sampling.
x y
11 100
13 80
15 80
12 90
20 60
17 60
15 70
13 90
15 90
17 80
a. Complete the linear regression equation below Round to one decimal place as needed.) b. Calculate the sum of the squared residuals. SSE-L (Round to the nearest whole number as needed) What is the total sum of...
Using your calculator, run a regression analysis on the following bivariate set of data with y as the response variable. x y 71.2 23.1 90.8 122.9 88.8 82.9 57.7 18.3 71.4 8.6 60.4 25.9 60.2 -43.1 88.5...
Using your calculator, run a regression analysis on the following bivariate set of data with y as the response variable. x y 71.2 23.1 90.8 122.9 88.8 82.9 57.7 18.3 71.4 8.6 60.4 25.9 60.2 -43.1 88.5 77.4 68.2 -5.9 41.1 -83 61.4 -2.5 87.1 39.4 Find the correlation coefficient and report it accurate to three decimal places. r = What proportion of the variation in y can be explained by the variation in the values of x? Report answer...
2.) The data set named "HW 6.2" contains a random sample of 35 movies released in 2008 collected from the Internet Movie Database (IMDb). The goal of this problem is to explore if the informa...
 2.) The data set named "HW 6.2" contains a random sample of 35 movies released in 2008 collected from the Internet Movie Database (IMDb). The goal of this problem is to explore if the information available soon after a movie's theatrical release can successfully predict total revenue. All dollar amounts (i.e., variables "Budget", "Opening", and "USRevenue") are measured in millions of dollars. . Investigate the relationship between the explanatory variable "Budget" and response variable "USRevenue" by doing the following: a....
Problem 4: Variables that may affect Grades The data set contains a random sample of STAT 250 Final Exam Scores out of 80 points. For each individual sampled, the time (in hours per week) that the stu...
Problem 4: Variables that may affect Grades The data set contains a random sample of STAT 250 Final Exam Scores out of 80 points. For each individual sampled, the time (in hours per week) that the student spent participating in a GMU club or sport and working for pay outside of GMU was recorded. Values of 0 indicate the students either does not participate in a club or sport or does not work a job for pay. The goal of...
 A set of bivariate data consists of these measurements on two variables, x and y: 2 4 4 6 8 4 7 6 (a) Make a scatterplot. Comment on the form, direction, and strength of the relationship. The relationship appears to be linear, positive, and fairly weak. The relationship appears to be linear, negative, and fairly strong. The relationship appears to be linear, positive, and fairly strong. The relationship appears to be linear, negative, and fairly weak. ● The relationship...
 3. Consider the following data for two variables, x and y. 4 5 4 6 4 6 9 5 11 a. Does there appear to be a linear relationship between x and y? Explain. b. Develop the estimated regression equation relating x and y. c. Plot the standardized residuals versus g for the estimated regression equation developed in part (b). Do the model assumptions appear to be satisfied? Explain. d. Perform a logarithmic transformation on the dependent variable y. Develop...
 The data shown below for the dependent variable, y, and the independent variable, x, have been collected using simple random sampling. X 10 15 11 19 18 17 5 17 18 y 9070 30 8020 30 5060 40 40 a. Develop a simple linear regression equation for these data. b. Calculate the sum of squared residuals, the total sum of squares, and the coefficient of determination c. Calculate the standard error of the estimate. d. Calculate the standard error for...
 The data shown below for the dependent variable, y, and the
independent variable, x, have been collected using simple random
sampling.
x y
11 100
13 80
15 80
12 90
20 60
17 60
15 70
13 90
15 90
17 80
a. Complete the linear regression equation below Round to one decimal place as needed.) b. Calculate the sum of the squared residuals. SSE-L (Round to the nearest whole number as needed) What is the total sum of...
The data shown below for the dependent variable, y, and the
independent variable, x, have been collected using simple random
sampling.
x y
11 100
13 80
15 80
12 90
20 60
17 60
15 70
13 90
15 90
17 80
a. Complete the linear regression equation below Round to one decimal place as needed.) b. Calculate the sum of the squared residuals. SSE-L (Round to the nearest whole number as needed) What is the total sum of...
 2.) The data set named "HW 6.2" contains a random sample of 35 movies released in 2008 collected from the Internet Movie Database (IMDb). The goal of this problem is to explore if the information available soon after a movie's theatrical release can successfully predict total revenue. All dollar amounts (i.e., variables "Budget", "Opening", and "USRevenue") are measured in millions of dollars. . Investigate the relationship between the explanatory variable "Budget" and response variable "USRevenue" by doing the following: a....
Most questions answered within 3 hours.
-
Where is the error in this code sequence?
String s1 = "Hello";
String s2 = "ello";...
asked 10 months ago -
Financial data for Joel de Paris, Inc., for last year
follow:
Joel de Paris, Inc.
Balance...
asked 10 months ago -
Consider this reaction:
Al2(SO4)3 (aq)+ BaCl3
(aq) Al2Cl6 (aq)- +
3BaSO4(s) . What is the...
asked 10 months ago -
Suppose that Savneet is considering increasing her
recent random sample from 20 car rentals to 40...
asked 10 months ago -
Trucks arrive at an unloading terminal at an average rate of 120
per hour.
Trucks arrive...
asked 10 months ago -
Why are methanol and ethanol completely soluble in water while
octanol is not very little soluble....
asked 10 months ago -
A facilities manager at a university reads in a research report
that the mean amount of...
asked 10 months ago -
When the CuSO4 is rehydrated by adding water to the anhydrous
compound, is this an endothermic...
asked 10 months ago -
A ray of sunlight is passing from diamond into crown glass; the
angle of incidence is...
asked 10 months ago -
A block of mass 0.249 kg is placed on top of a light, vertical
spring of...
asked 10 months ago -
how do the kidneys compensate in the presences of acidosis
a) trigger hyperventilate
b) reserve acid...
asked 10 months ago -
Question 501 pts
The rental rate of capital to the firm increases. Which of the
following...
asked 10 months ago