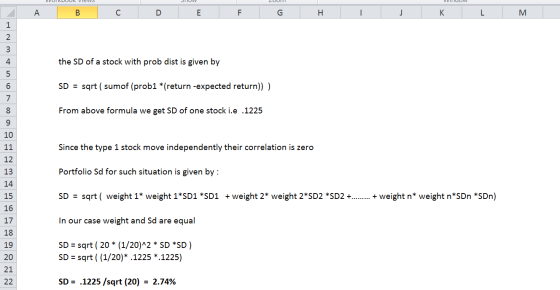
Consider an economy with two types of firms, S and I. S firms all move together. I firms move independently. For both types of firms, there is a 60% probability that the firms will have a 15% return and a 40% probability that the firms will have a −10% return. What is the volatility (standard deviation) of a portfolio that consists of an equal investment in 20 firms of (a) type S, and (b) type I?
My Question: Finding Standard deviation of type I stocks- not
sure how solution was found (see below)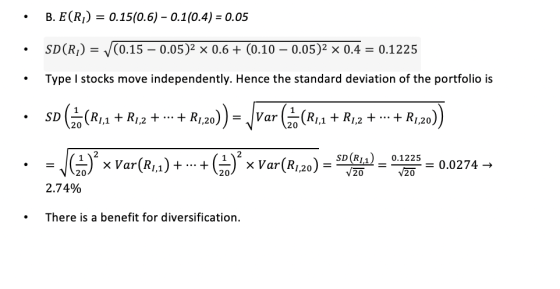
Homework Answers
Add Answer to:
Consider an economy with two types of firms, S and I. S firms
all move together....
Consider an economy with two types of firms, S and I. S firms all move together....
Consider an economy with two types of firms, S and I. S firms all move together. I firms move independently. For both types of firms, there is a 59 % probability that the firm will have a 24 % return and a 41 % probability that the firm will have a - 20 % return. What is the volatility (standard deviation) of a portfolio that consists of an equal investment in: a. 36 firms of type S? b. 36 firms...
Consider an economy with two types of firms, S and I. S firms always move together,...
 Consider an economy with two types of firms, S and I. S firms always move together, but I firms move independently of each other. For both types of firms there is a 50% probability that the firm will have a 20% return and a 50% probability that the firm will have a -30% return. The standard deviation for the return on an portfolio of 20 type S firms is closest to:
Consider an economy with two types of firms, S and I. S firms always move together,...
 Consider an economy with two types of firms, S and I. S firms always move together, but I firms move independently of each other. For both types of firms there is a 20% probability that the firm will have a 20% retum and a 80% probability that the firm will have a - 30% retum. The standard deviation for the return on an individual firm is closest to: O A. 8% OB. 10% O C. 20% OD. -20%
A. -5 % B. 5.59% C. 12.5% D. 25% Consider an economy with two types of...
 A. -5 %
B. 5.59%
C. 12.5%
D. 25%
Consider an economy with two types of firms, S and I. S firms always move together, but I firms move independently of each other. For both types of firms there is a 50% probability that the firm will have a 20% return and a 50% probability that the firm will have a - 30% return. The standard deviation for the return on a portfolio of 20 type | firms is closest...
A. -5 %
B. 5.59%
C. 12.5%
D. 25%
Consider an economy with two types of firms, S and I. S firms always move together, but I firms move independently of each other. For both types of firms there is a 50% probability that the firm will have a 20% return and a 50% probability that the firm will have a - 30% return. The standard deviation for the return on a portfolio of 20 type | firms is closest...
8. Calculate the PORTFOLIO Expected Return and standard deviation of a 60/40 Portfolio of Asset A...
 8. Calculate the PORTFOLIO Expected Return and standard deviation of a 60/40 Portfolio of Asset A and asset B. ASSET A 60% ASSET B 40% Return in State Return in State R (A) R(B) PORTFOLIO Rport in Sate S R(P)i Deviation R(P)i Pr Portfolio (Deviation Portfolio 2 State S Squared Dev*Pr Pr State P 0.4 0.6 E(R) E(R) Portfolio Portfolio Var Portfolio sd - 9. Compare the Risk-Return of the two stocks ALONE and the joint risk in the portfolio...
4. Suppose that a stock gave a realized return of 20% over a two-year time period...
4. Suppose that a stock gave a realized return of 20% over a two-year time period and a 10% return over the third year. The geometric average annual return is ________. (2 points) A) 8.28% B) 12.43% C) 14.08% D) 16.57% 5. Bear Stearns' stock price closed at $98, $103, $58, $29, $4 over five successive weeks. The weekly standard deviation of the stock price calculated from this sample is ________. (2 points) A) $30.07 B) $49.40 C) $42.96 D)...
(a) Suppose that the CAPM holds. Consider stocks A, B, C and D plotted in the graph below together with portfolios X, T (the tangency or market portfolio), Z, and the risk-free asset S. No explanation...
 (a) Suppose that the CAPM holds. Consider stocks A, B, C and D
plotted in the graph below together with portfolios X, T (the
tangency or market portfolio), Z, and the risk-free asset S. No
explanation necessary.
(i) If you could invest in the risk-free asset S and only one of
the stocks A, B, C or D, which stock would you choose?
(ii) Which of the stocks, A, B, C, or D, has the highest
beta?
(iii) Which of...
(a) Suppose that the CAPM holds. Consider stocks A, B, C and D
plotted in the graph below together with portfolios X, T (the
tangency or market portfolio), Z, and the risk-free asset S. No
explanation necessary.
(i) If you could invest in the risk-free asset S and only one of
the stocks A, B, C or D, which stock would you choose?
(ii) Which of the stocks, A, B, C, or D, has the highest
beta?
(iii) Which of...
I can't find the solution for (i), I tried the hint but still lost Let X...
 I can't find the solution for
(i), I tried the hint but still lost
Let X denote the amount of space occupied by an article placed in a 1-ft3 packing container. The pdf of X is below 90x8(1-x) 0 0<x<1 otherwise rx) = Adapt the following R code to graph the PDF in R. here the pdf is fx)-ax*u-x) 0<x<1 otherwise ### R Code a-a ; b-b ; ### You must plug in values for a and b. r seq(0,1,0,01)...
I can't find the solution for
(i), I tried the hint but still lost
Let X denote the amount of space occupied by an article placed in a 1-ft3 packing container. The pdf of X is below 90x8(1-x) 0 0<x<1 otherwise rx) = Adapt the following R code to graph the PDF in R. here the pdf is fx)-ax*u-x) 0<x<1 otherwise ### R Code a-a ; b-b ; ### You must plug in values for a and b. r seq(0,1,0,01)...
Can I get Help with number two please? DI. JUUSUIINUS Name Ryan Conniff Answer each of...
 Can I get Help with number two please?
DI. JUUSUIINUS Name Ryan Conniff Answer each of the problems below using the information provided and SHOW YOUR WORK FOR ALL PROBLEMS. Use this data for problems 1-2. The annual returns for securities A, B, C, D and the Market (S&P 500) are shown below. Remember to show all calculations. t - A, % B, % C, % D, % Mkt, % 1 18.56 18.23 8.43 12.43 12.28 2 12.34 5.24 3.12...
Can I get Help with number two please?
DI. JUUSUIINUS Name Ryan Conniff Answer each of the problems below using the information provided and SHOW YOUR WORK FOR ALL PROBLEMS. Use this data for problems 1-2. The annual returns for securities A, B, C, D and the Market (S&P 500) are shown below. Remember to show all calculations. t - A, % B, % C, % D, % Mkt, % 1 18.56 18.23 8.43 12.43 12.28 2 12.34 5.24 3.12...
The following ANOVA model is for a multiple regression model with two independent variables: Degrees of Sum of Mean Source Freedom Squares ...
 The following ANOVA model is for a multiple regression model
with two independent variables:
Degrees
of
Sum
of
Mean
Source
Freedom
Squares
Squares
F
Regression
2
60
Error
18
120
Total
20
180
Determine the Regression Mean Square (MSR):
Determine the Mean Square Error (MSE):
Compute the overall Fstat test statistic.
Is the Fstat significant at the 0.05 level?
A linear regression was run on auto sales relative to consumer
income. The Regression Sum of Squares (SSR) was 360 and...
The following ANOVA model is for a multiple regression model
with two independent variables:
Degrees
of
Sum
of
Mean
Source
Freedom
Squares
Squares
F
Regression
2
60
Error
18
120
Total
20
180
Determine the Regression Mean Square (MSR):
Determine the Mean Square Error (MSE):
Compute the overall Fstat test statistic.
Is the Fstat significant at the 0.05 level?
A linear regression was run on auto sales relative to consumer
income. The Regression Sum of Squares (SSR) was 360 and...
 Consider an economy with two types of firms, S and I. S firms always move together, but I firms move independently of each other. For both types of firms there is a 50% probability that the firm will have a 20% return and a 50% probability that the firm will have a -30% return. The standard deviation for the return on an portfolio of 20 type S firms is closest to:
 Consider an economy with two types of firms, S and I. S firms always move together, but I firms move independently of each other. For both types of firms there is a 20% probability that the firm will have a 20% retum and a 80% probability that the firm will have a - 30% retum. The standard deviation for the return on an individual firm is closest to: O A. 8% OB. 10% O C. 20% OD. -20%
 A. -5 %
B. 5.59%
C. 12.5%
D. 25%
Consider an economy with two types of firms, S and I. S firms always move together, but I firms move independently of each other. For both types of firms there is a 50% probability that the firm will have a 20% return and a 50% probability that the firm will have a - 30% return. The standard deviation for the return on a portfolio of 20 type | firms is closest...
A. -5 %
B. 5.59%
C. 12.5%
D. 25%
Consider an economy with two types of firms, S and I. S firms always move together, but I firms move independently of each other. For both types of firms there is a 50% probability that the firm will have a 20% return and a 50% probability that the firm will have a - 30% return. The standard deviation for the return on a portfolio of 20 type | firms is closest...
 8. Calculate the PORTFOLIO Expected Return and standard deviation of a 60/40 Portfolio of Asset A and asset B. ASSET A 60% ASSET B 40% Return in State Return in State R (A) R(B) PORTFOLIO Rport in Sate S R(P)i Deviation R(P)i Pr Portfolio (Deviation Portfolio 2 State S Squared Dev*Pr Pr State P 0.4 0.6 E(R) E(R) Portfolio Portfolio Var Portfolio sd - 9. Compare the Risk-Return of the two stocks ALONE and the joint risk in the portfolio...
 (a) Suppose that the CAPM holds. Consider stocks A, B, C and D
plotted in the graph below together with portfolios X, T (the
tangency or market portfolio), Z, and the risk-free asset S. No
explanation necessary.
(i) If you could invest in the risk-free asset S and only one of
the stocks A, B, C or D, which stock would you choose?
(ii) Which of the stocks, A, B, C, or D, has the highest
beta?
(iii) Which of...
(a) Suppose that the CAPM holds. Consider stocks A, B, C and D
plotted in the graph below together with portfolios X, T (the
tangency or market portfolio), Z, and the risk-free asset S. No
explanation necessary.
(i) If you could invest in the risk-free asset S and only one of
the stocks A, B, C or D, which stock would you choose?
(ii) Which of the stocks, A, B, C, or D, has the highest
beta?
(iii) Which of...
 I can't find the solution for
(i), I tried the hint but still lost
Let X denote the amount of space occupied by an article placed in a 1-ft3 packing container. The pdf of X is below 90x8(1-x) 0 0<x<1 otherwise rx) = Adapt the following R code to graph the PDF in R. here the pdf is fx)-ax*u-x) 0<x<1 otherwise ### R Code a-a ; b-b ; ### You must plug in values for a and b. r seq(0,1,0,01)...
I can't find the solution for
(i), I tried the hint but still lost
Let X denote the amount of space occupied by an article placed in a 1-ft3 packing container. The pdf of X is below 90x8(1-x) 0 0<x<1 otherwise rx) = Adapt the following R code to graph the PDF in R. here the pdf is fx)-ax*u-x) 0<x<1 otherwise ### R Code a-a ; b-b ; ### You must plug in values for a and b. r seq(0,1,0,01)...
 Can I get Help with number two please?
DI. JUUSUIINUS Name Ryan Conniff Answer each of the problems below using the information provided and SHOW YOUR WORK FOR ALL PROBLEMS. Use this data for problems 1-2. The annual returns for securities A, B, C, D and the Market (S&P 500) are shown below. Remember to show all calculations. t - A, % B, % C, % D, % Mkt, % 1 18.56 18.23 8.43 12.43 12.28 2 12.34 5.24 3.12...
Can I get Help with number two please?
DI. JUUSUIINUS Name Ryan Conniff Answer each of the problems below using the information provided and SHOW YOUR WORK FOR ALL PROBLEMS. Use this data for problems 1-2. The annual returns for securities A, B, C, D and the Market (S&P 500) are shown below. Remember to show all calculations. t - A, % B, % C, % D, % Mkt, % 1 18.56 18.23 8.43 12.43 12.28 2 12.34 5.24 3.12...
 The following ANOVA model is for a multiple regression model
with two independent variables:
Degrees
of
Sum
of
Mean
Source
Freedom
Squares
Squares
F
Regression
2
60
Error
18
120
Total
20
180
Determine the Regression Mean Square (MSR):
Determine the Mean Square Error (MSE):
Compute the overall Fstat test statistic.
Is the Fstat significant at the 0.05 level?
A linear regression was run on auto sales relative to consumer
income. The Regression Sum of Squares (SSR) was 360 and...
The following ANOVA model is for a multiple regression model
with two independent variables:
Degrees
of
Sum
of
Mean
Source
Freedom
Squares
Squares
F
Regression
2
60
Error
18
120
Total
20
180
Determine the Regression Mean Square (MSR):
Determine the Mean Square Error (MSE):
Compute the overall Fstat test statistic.
Is the Fstat significant at the 0.05 level?
A linear regression was run on auto sales relative to consumer
income. The Regression Sum of Squares (SSR) was 360 and...
Most questions answered within 3 hours.
-
Where is the error in this code sequence?
String s1 = "Hello";
String s2 = "ello";...
asked 11 months ago -
Financial data for Joel de Paris, Inc., for last year
follow:
Joel de Paris, Inc.
Balance...
asked 11 months ago -
Consider this reaction:
Al2(SO4)3 (aq)+ BaCl3
(aq) Al2Cl6 (aq)- +
3BaSO4(s) . What is the...
asked 11 months ago -
Suppose that Savneet is considering increasing her
recent random sample from 20 car rentals to 40...
asked 11 months ago -
Trucks arrive at an unloading terminal at an average rate of 120
per hour.
Trucks arrive...
asked 11 months ago -
Why are methanol and ethanol completely soluble in water while
octanol is not very little soluble....
asked 11 months ago -
A facilities manager at a university reads in a research report
that the mean amount of...
asked 11 months ago -
When the CuSO4 is rehydrated by adding water to the anhydrous
compound, is this an endothermic...
asked 11 months ago -
A ray of sunlight is passing from diamond into crown glass; the
angle of incidence is...
asked 11 months ago -
A block of mass 0.249 kg is placed on top of a light, vertical
spring of...
asked 11 months ago -
how do the kidneys compensate in the presences of acidosis
a) trigger hyperventilate
b) reserve acid...
asked 11 months ago -
Question 501 pts
The rental rate of capital to the firm increases. Which of the
following...
asked 11 months ago