 In the graph below, the blue
solid curves are pre-tax, and the red dashed curve is post-tax.
Based on the graph, select ALL of the following are TRUE at the
post-tax equilibrium:
In the graph below, the blue
solid curves are pre-tax, and the red dashed curve is post-tax.
Based on the graph, select ALL of the following are TRUE at the
post-tax equilibrium:
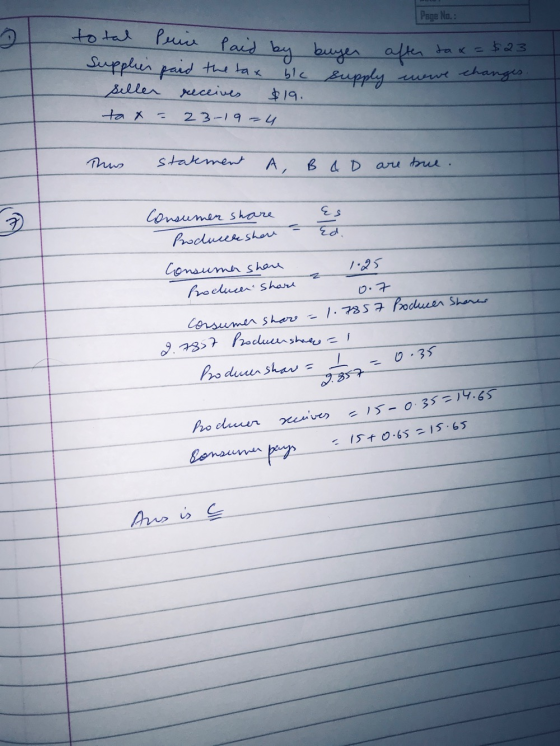
A. The total price the buyer pays is PD = $23.
B. The supplier submits the tax to the government.
C. The net price the seller receives is PS = $23.
D. The tax is $4 per unit.
E. The tax is 4% of the price.
F. The demander submits the tax to the government.
Question 7 of 10 At the equilibrium price of $15, the elasticity of demand and supply are –0.7 and 1.25. If the government institutes a tax of $1 per unit, sellers will receive ______and consumers will pay ______.
- A. $14.73, $15.73
- B. $15.64, $16.64
- C. $14.64, $15.64
- D. $15.73, $16.73
Homework Answers
Add Answer to:
In the graph below, the blue
solid curves are pre-tax, and the red dashed curve is...
The following graph shows the supply of (orange curve) and demand for (blue curve) computer keyboards....
 The following graph shows the supply of (orange curve) and demand for (blue curve) computer keyboards. Determine the equililbrium price and quantity of computer keyboards. Based on this, use the green triangle (triangl symbols) to shade the area representing consumer surplus at the equilibrium price. Then use the purple triangle (diamond symbols) to shade the area representing producer surplus at the equilibrium price. PRICE (Dollars per keyboard) 100 Supply CS 80 PS 60 Demand 40 20 50 100 150200 250...
QUESTION 12 Figure: The graph below shows a demand curve and four supply curves 1 Price...
 QUESTION 12 Figure: The graph below shows a demand curve and four supply curves 1 Price Refer to Figure. If a tax is imposed in the above market then which supply curve will have highest deadweight lossi a. S2 Oc. SA. d.53. QUESTION 18 When boats are taxed and sellers of boats are required to pay the tax to the government, a. there is a movement downward and to the right along the demand curve for boats. Ob the quantity...
Please box answers! Thank you. 11. Monetary policy and the LM curve Aa Aa The following graph shows the demand and supply of real money balances in a hypothetical economy. Use the black point (X point...
 Please box answers! Thank
you.
11. Monetary policy and the LM curve Aa Aa The following graph shows the demand and supply of real money balances in a hypothetical economy. Use the black point (X point) to indicate the equilibrium in this market. Dashed drop lines will automatically extend to both axes. REAL INTEREST RATE [Percent) 10 Equilibrium Supply New Supply New Equilibrium Demand 3 0 10 20 30 40 50 60 70 80 90 100 REAL MONEY BALANCES Help...
Please box answers! Thank
you.
11. Monetary policy and the LM curve Aa Aa The following graph shows the demand and supply of real money balances in a hypothetical economy. Use the black point (X point) to indicate the equilibrium in this market. Dashed drop lines will automatically extend to both axes. REAL INTEREST RATE [Percent) 10 Equilibrium Supply New Supply New Equilibrium Demand 3 0 10 20 30 40 50 60 70 80 90 100 REAL MONEY BALANCES Help...
 The following graph shows the supply of (orange curve) and demand for (blue curve) computer keyboards. Determine the equililbrium price and quantity of computer keyboards. Based on this, use the green triangle (triangl symbols) to shade the area representing consumer surplus at the equilibrium price. Then use the purple triangle (diamond symbols) to shade the area representing producer surplus at the equilibrium price. PRICE (Dollars per keyboard) 100 Supply CS 80 PS 60 Demand 40 20 50 100 150200 250...
 QUESTION 12 Figure: The graph below shows a demand curve and four supply curves 1 Price Refer to Figure. If a tax is imposed in the above market then which supply curve will have highest deadweight lossi a. S2 Oc. SA. d.53. QUESTION 18 When boats are taxed and sellers of boats are required to pay the tax to the government, a. there is a movement downward and to the right along the demand curve for boats. Ob the quantity...
 Please box answers! Thank
you.
11. Monetary policy and the LM curve Aa Aa The following graph shows the demand and supply of real money balances in a hypothetical economy. Use the black point (X point) to indicate the equilibrium in this market. Dashed drop lines will automatically extend to both axes. REAL INTEREST RATE [Percent) 10 Equilibrium Supply New Supply New Equilibrium Demand 3 0 10 20 30 40 50 60 70 80 90 100 REAL MONEY BALANCES Help...
Please box answers! Thank
you.
11. Monetary policy and the LM curve Aa Aa The following graph shows the demand and supply of real money balances in a hypothetical economy. Use the black point (X point) to indicate the equilibrium in this market. Dashed drop lines will automatically extend to both axes. REAL INTEREST RATE [Percent) 10 Equilibrium Supply New Supply New Equilibrium Demand 3 0 10 20 30 40 50 60 70 80 90 100 REAL MONEY BALANCES Help...
Most questions answered within 3 hours.
-
Where is the error in this code sequence?
String s1 = "Hello";
String s2 = "ello";...
asked 10 months ago -
Financial data for Joel de Paris, Inc., for last year
follow:
Joel de Paris, Inc.
Balance...
asked 10 months ago -
Consider this reaction:
Al2(SO4)3 (aq)+ BaCl3
(aq) Al2Cl6 (aq)- +
3BaSO4(s) . What is the...
asked 10 months ago -
Suppose that Savneet is considering increasing her
recent random sample from 20 car rentals to 40...
asked 10 months ago -
Trucks arrive at an unloading terminal at an average rate of 120
per hour.
Trucks arrive...
asked 10 months ago -
Why are methanol and ethanol completely soluble in water while
octanol is not very little soluble....
asked 10 months ago -
A facilities manager at a university reads in a research report
that the mean amount of...
asked 10 months ago -
When the CuSO4 is rehydrated by adding water to the anhydrous
compound, is this an endothermic...
asked 10 months ago -
A ray of sunlight is passing from diamond into crown glass; the
angle of incidence is...
asked 10 months ago -
A block of mass 0.249 kg is placed on top of a light, vertical
spring of...
asked 10 months ago -
how do the kidneys compensate in the presences of acidosis
a) trigger hyperventilate
b) reserve acid...
asked 10 months ago -
Question 501 pts
The rental rate of capital to the firm increases. Which of the
following...
asked 10 months ago