

Homework Answers

Add Answer to:
Question Completion Status: westion 10 Figure 7-10 1 Price Supply P2A.....D PUB 02 Refer to Figure...
Supply 29. Refer to Figure 6. When the price rises from PI to P2, which area...
 Supply 29. Refer to Figure 6. When the price rises from PI to P2, which area represents the increase in producer surplus to existing producers? a. BCG b. ACH c. DGH d. ABGD 30. Refer to Figure 6. Which area represents the increase in producer surplus when the price rises from P1 to P2 due to new producers entering the market? a. BCG b. ACH c. DGH d. AHGB Figure 7 Focus ed States) E E
Price Supply Q1 Q2 Quantity Refer to Figure 7-15. When the price rises from P1 to...
 Price Supply Q1 Q2 Quantity Refer to Figure 7-15. When the price rises from P1 to P2, what area represents the increase in producer surplus? OA. OA+B+C. ОА+В. OG.
Question Completion Status: Supply 8888888 10 20 30 40 50 60 70 80 90 e Refer...
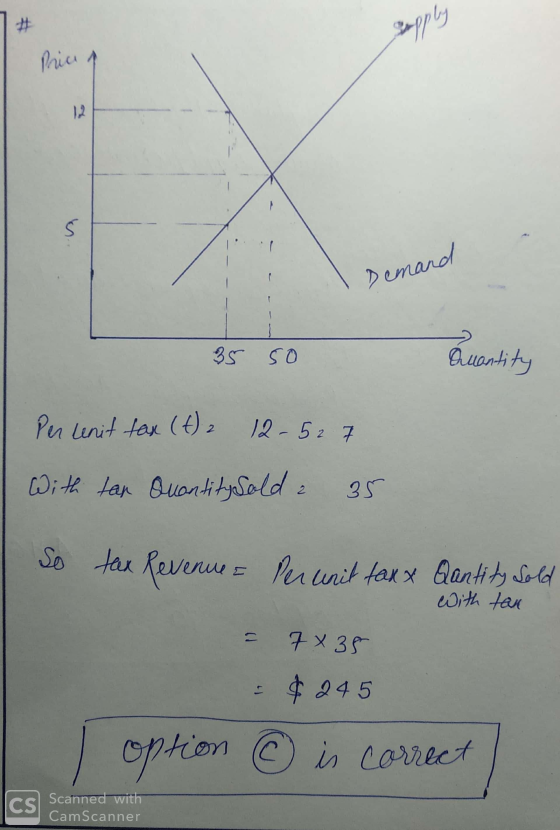
 Question Completion Status: Supply 8888888 10 20 30 40 50 60 70 80 90 e Refer to Figure 7-8. At the equilibrium price consumer surplus is a $2.450 $1.225 $1.575 $1.050 Lenovo 12 MB N. IM
* Question Completion Status: 1 Price 110 + 8 Supply 8 8 +- 8 Demand 8...
 * Question Completion Status: 1 Price 110 + 8 Supply 8 8 +- 8 Demand 8 40+ S89 + + - 10 20 30 40 50 60 70 80 90 100 110 120 130 140 150 160 170 Quantity Refer to Figure 7-22. At the equilibrium price, total surplus is a. $3,500 b. $7,000. c. $2,500. d. $1,000 Supply HT + + + + + + + + + Demand + + + + 2 + 3 + 4 +...
Figure 9 Price F D B PI G c - P2 Demand Quantity Q1 02 Refer...
 Figure 9 Price F D B PI G c - P2 Demand Quantity Q1 02 Refer to Figure 9. Which area represents consumer surplus at a price of P1? a. BDF b. AFG C. ABDG d. ABC Refer to Figure 9. Which area represents consumer surplus at a price of P2? a. BDF b. AFG C. ABDG d. ABC Refer to Figure 9. Which area represents the increase in consumer surplus when the price falls from P1 to P2? a....
Figure 9-11 Price Domestic Supply World Price Domestic Demand Quantity Refer to Figure 9.11. Consumer surplus in...
 Figure 9-11 Price Domestic Supply World Price Domestic Demand Quantity Refer to Figure 9.11. Consumer surplus in this market before trade is O a. A Ob. B+C O c. A+B+D. O d.c. Supply Demand Refer to Figure 7-21. Which area represents consumer surplus when the price is P1? O a. A O b.B ос. С To a.D
QUESTION 3 Figure Price Supply P K I P" P B M N Demand Quantity Refer...
 QUESTION 3 Figure Price Supply P K I P" P B M N Demand Quantity Refer to Figure. If the government imposes a tax size of P- P" in the above market then the area L+M+Y represents a. consumer surplus after the tax. producer surplus after the tax. Cconsumer surplus before the tax. producer surplus before the tax. QUESTION 4 4 point Figure Supply Dennd Quantity Q1 02 Q3 Q Qs Refer to Figure. If the government impose a tax...
Figure 7-4 Refer to Figure 7-4. When the price falls from P1 to P2, which...
 Figure 7-4
Refer to Figure 7-4. When the price falls from P1
to P2, which area represents the increase in consumer surplus to
new buyers entering the market?
Group of answer choices
AFG
ABC
BDF
BCGD
We were unable to transcribe this imageQuestion: Figure 7-4 Refer to Figure 7-4. When the Figure 7-4 Price 02 Demand Quaranty Refer to Figure 7-4. When the price falls from Pi to P2, which area represents the increase in consu surplus to new...
Figure 7-4
Refer to Figure 7-4. When the price falls from P1
to P2, which area represents the increase in consumer surplus to
new buyers entering the market?
Group of answer choices
AFG
ABC
BDF
BCGD
We were unable to transcribe this imageQuestion: Figure 7-4 Refer to Figure 7-4. When the Figure 7-4 Price 02 Demand Quaranty Refer to Figure 7-4. When the price falls from Pi to P2, which area represents the increase in consu surplus to new...
econ 211 A Question 3 Refer to Figure 7-2 Which area represents the increase in consumer...
 econ 211
A Question 3 Refer to Figure 7-2 Which area represents the increase in consumer surplus when the price falls from P1 to P2? ABD ACG DFG BCGD Question 4 Refer to Figure 10-1 Supply esc # $ % & 2 3 4 5
econ 211
A Question 3 Refer to Figure 7-2 Which area represents the increase in consumer surplus when the price falls from P1 to P2? ABD ACG DFG BCGD Question 4 Refer to Figure 10-1 Supply esc # $ % & 2 3 4 5
Figure 7-2 1 Prive A N B c P2 D F Demand Decreto Q2 02 Refer...
 Figure 7-2 1 Prive A N B c P2 D F Demand Decreto Q2 02 Refer to Figure 7-2. When the price is P2, consumer surplus is OA B. A+B. A+B+C.
 Supply 29. Refer to Figure 6. When the price rises from PI to P2, which area represents the increase in producer surplus to existing producers? a. BCG b. ACH c. DGH d. ABGD 30. Refer to Figure 6. Which area represents the increase in producer surplus when the price rises from P1 to P2 due to new producers entering the market? a. BCG b. ACH c. DGH d. AHGB Figure 7 Focus ed States) E E
 Price Supply Q1 Q2 Quantity Refer to Figure 7-15. When the price rises from P1 to P2, what area represents the increase in producer surplus? OA. OA+B+C. ОА+В. OG.
 Question Completion Status: Supply 8888888 10 20 30 40 50 60 70 80 90 e Refer to Figure 7-8. At the equilibrium price consumer surplus is a $2.450 $1.225 $1.575 $1.050 Lenovo 12 MB N. IM
 * Question Completion Status: 1 Price 110 + 8 Supply 8 8 +- 8 Demand 8 40+ S89 + + - 10 20 30 40 50 60 70 80 90 100 110 120 130 140 150 160 170 Quantity Refer to Figure 7-22. At the equilibrium price, total surplus is a. $3,500 b. $7,000. c. $2,500. d. $1,000 Supply HT + + + + + + + + + Demand + + + + 2 + 3 + 4 +...
 Figure 9 Price F D B PI G c - P2 Demand Quantity Q1 02 Refer to Figure 9. Which area represents consumer surplus at a price of P1? a. BDF b. AFG C. ABDG d. ABC Refer to Figure 9. Which area represents consumer surplus at a price of P2? a. BDF b. AFG C. ABDG d. ABC Refer to Figure 9. Which area represents the increase in consumer surplus when the price falls from P1 to P2? a....
 Figure 9-11 Price Domestic Supply World Price Domestic Demand Quantity Refer to Figure 9.11. Consumer surplus in this market before trade is O a. A Ob. B+C O c. A+B+D. O d.c. Supply Demand Refer to Figure 7-21. Which area represents consumer surplus when the price is P1? O a. A O b.B ос. С To a.D
 QUESTION 3 Figure Price Supply P K I P" P B M N Demand Quantity Refer to Figure. If the government imposes a tax size of P- P" in the above market then the area L+M+Y represents a. consumer surplus after the tax. producer surplus after the tax. Cconsumer surplus before the tax. producer surplus before the tax. QUESTION 4 4 point Figure Supply Dennd Quantity Q1 02 Q3 Q Qs Refer to Figure. If the government impose a tax...
 Figure 7-4
Refer to Figure 7-4. When the price falls from P1
to P2, which area represents the increase in consumer surplus to
new buyers entering the market?
Group of answer choices
AFG
ABC
BDF
BCGD
We were unable to transcribe this imageQuestion: Figure 7-4 Refer to Figure 7-4. When the Figure 7-4 Price 02 Demand Quaranty Refer to Figure 7-4. When the price falls from Pi to P2, which area represents the increase in consu surplus to new...
Figure 7-4
Refer to Figure 7-4. When the price falls from P1
to P2, which area represents the increase in consumer surplus to
new buyers entering the market?
Group of answer choices
AFG
ABC
BDF
BCGD
We were unable to transcribe this imageQuestion: Figure 7-4 Refer to Figure 7-4. When the Figure 7-4 Price 02 Demand Quaranty Refer to Figure 7-4. When the price falls from Pi to P2, which area represents the increase in consu surplus to new...
 econ 211
A Question 3 Refer to Figure 7-2 Which area represents the increase in consumer surplus when the price falls from P1 to P2? ABD ACG DFG BCGD Question 4 Refer to Figure 10-1 Supply esc # $ % & 2 3 4 5
econ 211
A Question 3 Refer to Figure 7-2 Which area represents the increase in consumer surplus when the price falls from P1 to P2? ABD ACG DFG BCGD Question 4 Refer to Figure 10-1 Supply esc # $ % & 2 3 4 5
 Figure 7-2 1 Prive A N B c P2 D F Demand Decreto Q2 02 Refer to Figure 7-2. When the price is P2, consumer surplus is OA B. A+B. A+B+C.
Most questions answered within 3 hours.
-
Where is the error in this code sequence?
String s1 = "Hello";
String s2 = "ello";...
asked 10 months ago -
Financial data for Joel de Paris, Inc., for last year
follow:
Joel de Paris, Inc.
Balance...
asked 10 months ago -
Consider this reaction:
Al2(SO4)3 (aq)+ BaCl3
(aq) Al2Cl6 (aq)- +
3BaSO4(s) . What is the...
asked 10 months ago -
Suppose that Savneet is considering increasing her
recent random sample from 20 car rentals to 40...
asked 10 months ago -
Trucks arrive at an unloading terminal at an average rate of 120
per hour.
Trucks arrive...
asked 10 months ago -
Why are methanol and ethanol completely soluble in water while
octanol is not very little soluble....
asked 10 months ago -
A facilities manager at a university reads in a research report
that the mean amount of...
asked 10 months ago -
When the CuSO4 is rehydrated by adding water to the anhydrous
compound, is this an endothermic...
asked 10 months ago -
A ray of sunlight is passing from diamond into crown glass; the
angle of incidence is...
asked 10 months ago -
A block of mass 0.249 kg is placed on top of a light, vertical
spring of...
asked 10 months ago -
how do the kidneys compensate in the presences of acidosis
a) trigger hyperventilate
b) reserve acid...
asked 10 months ago -
Question 501 pts
The rental rate of capital to the firm increases. Which of the
following...
asked 10 months ago