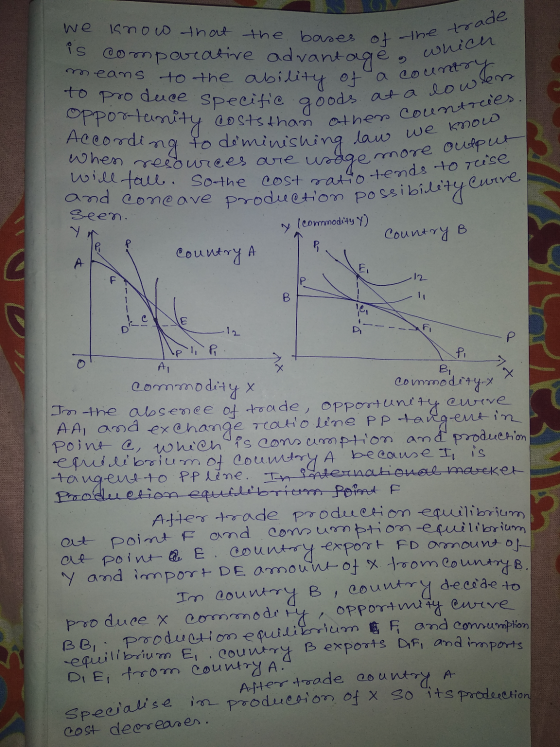
with the aid of a diagram, illustrate what happens to the equilibrium number of firms, prices,...
with the aid of a diagram, illustrate what happens to the equilibrium number of firms, prices, and average cost when one country opens up to trade (integrates its market) with another country. Explain whether consumers in the original country are better off, and specifically how.
Homework Answers

Add Answer to:
with the aid of a diagram, illustrate what happens to the
equilibrium number of firms, prices,...
1. Labour Market. Draw a diagram of the labour market where there above the equilibrium level....
 1. Labour Market. Draw a diagram of the labour market where there above the equilibrium level. Use I to denote the amount of labour to denote the amount of labour hired. bour market where the real wage is stuck note the amount of labour willing to work and L1 Now suppose there is an increase in technology that raises the demand the new demand curve and explain what happens to the and curve and explain what happens to the number...
Please provide a detailed response so that I may be able to understand how you came...
 Please provide a detailed response so that I may be able to
understand how you came to your answer. Thank you!!!
freely trading Problem 2. (Monopolistic competition) [week 5]. Consider two countries that are in differentiated products. Each producer in the industry is subject to increasing returns to scale, derived from fixed costs of production. In particular, the cost function of a firm in the industry is linear with respect to output, with fixed costs of 100 and variable costs...
Please provide a detailed response so that I may be able to
understand how you came to your answer. Thank you!!!
freely trading Problem 2. (Monopolistic competition) [week 5]. Consider two countries that are in differentiated products. Each producer in the industry is subject to increasing returns to scale, derived from fixed costs of production. In particular, the cost function of a firm in the industry is linear with respect to output, with fixed costs of 100 and variable costs...
6. Suppose a competitive market is in long-run equilibrium. How does the number of firms change...
 6. Suppose a competitive market is in long-run equilibrium. How does the number of firms change if (i) Each firm's fixed costs decreases? Explain (ii) Each firm's marginal cost decreases? Explain (i) Demand decreases: for each price, consumers demand half of the amount as before? Explain
The market for coffee is perfectly competitive, has a large number of identical firms, and is...
 The market for coffee is perfectly competitive, has a large number of identical firms, and is in LONG-RUN equilibrium. The market demand curve is downward sloping, and the cost schedules have their usual shapes. Market price for a unit of coffee is $10. There is a decrease in the price of tea, a substitute for coffee. [A] In the SHORT RUN, in appropriate diagrams, show what happens to price, industry output, and the output and profits of a representative firm...
1. Briefly describe 2 government-imposed barriers to entry that help larger firms avoid some competition, and...
1. Briefly describe 2 government-imposed barriers to entry that help larger firms avoid some competition, and then explain the impact that these government actions have on consumer prices. 2. Why does Accounting Profit exclude all other implicit costs except the implicit cost of depreciation? 3. As it specifically impacts consumers and producers, when is a product’s price in equilibrium? 4. Why does less available time to make a purchase coupled with fewer readily available substitutes for any given product usually...
EC202-5-FY 10 9Answer both parts of this question. (a) Firm A and Firm B produce a homogenous good and are Cournot duopolists. The firms face an inverse market demand curve given by P 10-Q. where...
 EC202-5-FY 10 9Answer both parts of this question. (a) Firm A and Firm B produce a homogenous good and are Cournot duopolists. The firms face an inverse market demand curve given by P 10-Q. where P is the market price and Q is the market quantity demanded. The marginal and average cost of each firm is 4 i. 10 marks] Show that if the firms compete as Cournot duopolists that the total in- dustry output is 4 and that if...
4.The article mentions that when prices are low, farmers may have an incentive to plant additional...
4.The article mentions that when prices are low, farmers may have an incentive to plant additional acres. Explain why this does or does not conform with the principle of marginal analysis. Feel free to use an example of how a farmer may choose whether or not to plant an additional acre of corn to explain your answer. (2 points) 5.Using a supply and demand diagram, illustrate and explain how we might expect equilibrium price and quantity for corn to change...
pls answer as many qwuestions!! 1. A market has an inverse demand curve and four firms,...
 pls
answer as many qwuestions!!
1. A market has an inverse demand curve and four firms, each of which has a constant marginal cost of. If the firms form a profit-maximizing cartel and agree to operate subject to the constraint that each firm will produce the same output level, how much does each firm produce? 2. Duopoly quantity-setting firms face the market demand curve. Each firm has a marginal cost of $60 per unit. a. What is the Nash-Cournot equilibrium?...
pls
answer as many qwuestions!!
1. A market has an inverse demand curve and four firms, each of which has a constant marginal cost of. If the firms form a profit-maximizing cartel and agree to operate subject to the constraint that each firm will produce the same output level, how much does each firm produce? 2. Duopoly quantity-setting firms face the market demand curve. Each firm has a marginal cost of $60 per unit. a. What is the Nash-Cournot equilibrium?...
Assume we divide up the world into two regions: the United States and the rest of...
Assume we divide up the world into two regions: the United States and the rest of the world. We will examine the competitive market for simple 2 GB flash drives and the trade between the United States and the rest of the world. We know the supply and demand conditions in each region, which are summarized below: Rest of the World: Supply curve: P=3+Qs P: Price of flash drives Qs: Quantity of flash drives supplied (millions) Demand curve: P=12-2*Qd...
Please help with the following microeconomics question 3: 1. A city has a large number of...
Please help with the following microeconomics question 3: 1. A city has a large number of casinos. The demand by patrons for the games (in thousands per week) is Qd = 90 - 3P and the supply is Qs = 3P where P is the price charged to play a game. What is the equilibrium number (quantity) of games played? What is the equilibrium price? 2. Continue your analysis of the casino market in the city: demand by patrons for...
 1. Labour Market. Draw a diagram of the labour market where there above the equilibrium level. Use I to denote the amount of labour to denote the amount of labour hired. bour market where the real wage is stuck note the amount of labour willing to work and L1 Now suppose there is an increase in technology that raises the demand the new demand curve and explain what happens to the and curve and explain what happens to the number...
 Please provide a detailed response so that I may be able to
understand how you came to your answer. Thank you!!!
freely trading Problem 2. (Monopolistic competition) [week 5]. Consider two countries that are in differentiated products. Each producer in the industry is subject to increasing returns to scale, derived from fixed costs of production. In particular, the cost function of a firm in the industry is linear with respect to output, with fixed costs of 100 and variable costs...
Please provide a detailed response so that I may be able to
understand how you came to your answer. Thank you!!!
freely trading Problem 2. (Monopolistic competition) [week 5]. Consider two countries that are in differentiated products. Each producer in the industry is subject to increasing returns to scale, derived from fixed costs of production. In particular, the cost function of a firm in the industry is linear with respect to output, with fixed costs of 100 and variable costs...
 6. Suppose a competitive market is in long-run equilibrium. How does the number of firms change if (i) Each firm's fixed costs decreases? Explain (ii) Each firm's marginal cost decreases? Explain (i) Demand decreases: for each price, consumers demand half of the amount as before? Explain
 The market for coffee is perfectly competitive, has a large number of identical firms, and is in LONG-RUN equilibrium. The market demand curve is downward sloping, and the cost schedules have their usual shapes. Market price for a unit of coffee is $10. There is a decrease in the price of tea, a substitute for coffee. [A] In the SHORT RUN, in appropriate diagrams, show what happens to price, industry output, and the output and profits of a representative firm...
 EC202-5-FY 10 9Answer both parts of this question. (a) Firm A and Firm B produce a homogenous good and are Cournot duopolists. The firms face an inverse market demand curve given by P 10-Q. where P is the market price and Q is the market quantity demanded. The marginal and average cost of each firm is 4 i. 10 marks] Show that if the firms compete as Cournot duopolists that the total in- dustry output is 4 and that if...
 pls
answer as many qwuestions!!
1. A market has an inverse demand curve and four firms, each of which has a constant marginal cost of. If the firms form a profit-maximizing cartel and agree to operate subject to the constraint that each firm will produce the same output level, how much does each firm produce? 2. Duopoly quantity-setting firms face the market demand curve. Each firm has a marginal cost of $60 per unit. a. What is the Nash-Cournot equilibrium?...
pls
answer as many qwuestions!!
1. A market has an inverse demand curve and four firms, each of which has a constant marginal cost of. If the firms form a profit-maximizing cartel and agree to operate subject to the constraint that each firm will produce the same output level, how much does each firm produce? 2. Duopoly quantity-setting firms face the market demand curve. Each firm has a marginal cost of $60 per unit. a. What is the Nash-Cournot equilibrium?...
Most questions answered within 3 hours.
-
Where is the error in this code sequence?
String s1 = "Hello";
String s2 = "ello";...
asked 11 months ago -
Financial data for Joel de Paris, Inc., for last year
follow:
Joel de Paris, Inc.
Balance...
asked 11 months ago -
Consider this reaction:
Al2(SO4)3 (aq)+ BaCl3
(aq) Al2Cl6 (aq)- +
3BaSO4(s) . What is the...
asked 11 months ago -
Suppose that Savneet is considering increasing her
recent random sample from 20 car rentals to 40...
asked 11 months ago -
Trucks arrive at an unloading terminal at an average rate of 120
per hour.
Trucks arrive...
asked 11 months ago -
Why are methanol and ethanol completely soluble in water while
octanol is not very little soluble....
asked 11 months ago -
A facilities manager at a university reads in a research report
that the mean amount of...
asked 11 months ago -
When the CuSO4 is rehydrated by adding water to the anhydrous
compound, is this an endothermic...
asked 11 months ago -
A ray of sunlight is passing from diamond into crown glass; the
angle of incidence is...
asked 11 months ago -
A block of mass 0.249 kg is placed on top of a light, vertical
spring of...
asked 11 months ago -
how do the kidneys compensate in the presences of acidosis
a) trigger hyperventilate
b) reserve acid...
asked 11 months ago -
Question 501 pts
The rental rate of capital to the firm increases. Which of the
following...
asked 11 months ago