
Homework Answers
Add Answer to:
Consider the market for ethanol in the United States depicted in the figure to the right....
Suppose that the demand and supply curves for ethanol in the United States are represented by...
Suppose that the demand and supply curves for ethanol in the United States are represented by the following equations: QD = 1,600 − 320P QS = −800 + 640P where QD is the quantity demanded (in millions of gallons per month), QS is the quantity supplied, and P is the price (in dollars per gallon). In the scenario above, if the market is in equilibrium, the price of ethanol is $(blank) per gallon and the quantity of ethanol sold is...
The U.S. wheat market is shown in the figure below. Suppose the United States wants to...
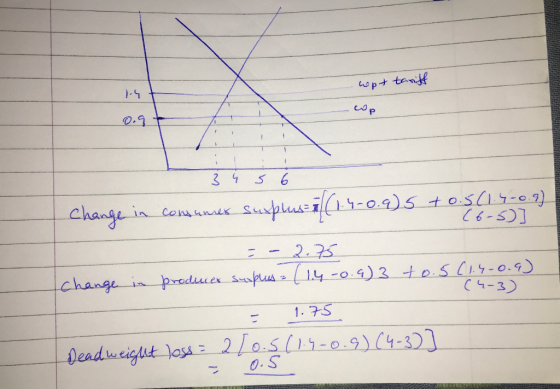
 The U.S. wheat market is shown in the figure below. Suppose the United States wants to protect its wheat industry by imposing a tariff of $1 per bushel on foreign wheat, which currently sells at the world price of $4 per bushel. Your Graph Score: 0% Price (S) CS 10 PS DWL2 DWL CS World price 20 40 60 80 100 120 140 160 180 Quantity of wheat (millions) a. Use the tool provided (CS) to draw the consumer surplus...
3. Refer to the figure. The United States is currently open to international trade in the...
 3. Refer to the figure. The United States is currently open to international trade in the market of basketballs, but domestic producers are lobbying to ban the importation of basketballs from abroad for national security reasons. Domestic producers claim that they are unable to compete with foreign producers based on price and that eventually they would be forced to close their shops domestically. This would give foreign producers the power to cut off the supply of basketballs to the United...
Assume we divide up the world into two regions: the United States and the rest of...
Assume we divide up the world into two regions: the United States and the rest of the world. We will examine the competitive market for simple 2 GB flash drives and the trade between the United States and the rest of the world. We know the supply and demand conditions in each region, which are summarized below: Rest of the World: Supply curve: P=3+Qs P: Price of flash drives Qs: Quantity of flash drives supplied (millions) Demand curve: P=12-2*Qd...
1) The United States sugar industry has enjoyed trade protection for several years. As a result,...
 1) The United States sugar industry has enjoyed trade protection for several years. As a result, sugar prices in the U.S. are higher than the average world price. Suppose that the domestic demand and domestic supply for sugar are as provided in the table below (assume continuous, linear domestic demand and supply curves which include the following data points for sugar): | Price ($ per Quantity Demanded Domestically Quantity Supplied Domestically pound) (Millions of Pounds per Year) (Millions of Pounds...
INTERNATIONAL TRADE WORKSHEET 2 Below, you are provided with the demand and supply curves for orange...
 INTERNATIONAL TRADE WORKSHEET 2 Below, you are provided with the demand and supply curves for orange juice. You will use this information to identify whether the country imports or exports orange juice. You will also determine whether producers and/or consumers win by engaging in international trade. $7 Price (per gallon) $6 Supply $5 $4 $3 $2 $1 Demand 30 60 210 90 120 150 180 Quantity of Orange Juice (in gallons) Part 1: Suppose that the country depicted above does...
Consider the market for wheat, depicted in the figure to the right Suppose a price floor...
 Consider the market for wheat, depicted in the figure to the right Suppose a price floor of government is imposed by the As a result of the price floor there is a of wheat Compared with the market clearing equilibrium, is the price floor efficient? What are represents the loss in efficiency in terms of consumer and producer surplus resulting from the price floor? Use the triangle drawing tool to shade in deadweight loss Label this shaded area Deadweight Loss...
7. Problems and Applications Q7 Congress and the president decide that the United States should reduce...
 7. Problems and Applications Q7 Congress and the president decide that the United States should reduce air pollution by reducing its use of gasoline. They impose a $0.50 tax on each gallon of gasoline sold. Suppose they decided to impose the tax on producers. In the following graph, shows the effect of a $0.50 tax on each gallon of gasoline sold imposed on producers by shifting the demand or supply curve. Supply Demand Supply Price of Gasoline (Dollars per gallon)...
please only do problem d e and f thanks! 1) The United States sugar industry has enjoyed trade protection for several y...
 please only do problem d e and f
thanks!
1) The United States sugar industry has enjoyed trade protection for several years. As a result, sugar prices in the U.S. are higher than the average world price. Suppose that the domestic demand and domestic supply for sugar are as provided in the table below (assume continuous, linear domestic demand and supply curves which include the following data points for sugar): | Price ($ per Quantity Demanded Domestically Quantity Supplied Domestically...
please only do problem d e and f
thanks!
1) The United States sugar industry has enjoyed trade protection for several years. As a result, sugar prices in the U.S. are higher than the average world price. Suppose that the domestic demand and domestic supply for sugar are as provided in the table below (assume continuous, linear domestic demand and supply curves which include the following data points for sugar): | Price ($ per Quantity Demanded Domestically Quantity Supplied Domestically...
1) Consider two countries, M and N. The value of export of country M is 400...
1) Consider two countries, M and N. The value of export of country M is 400 billion US dollar and its GDP is 800 billion US dollar. The value of export of country N is 300 billion US dollar, and its GDP is 900 billion US dollar. Which country has more openness to international trade? a) Country N b) Country M c) It is not possible to know this d) The two countries are equally open 2) What is the...
 The U.S. wheat market is shown in the figure below. Suppose the United States wants to protect its wheat industry by imposing a tariff of $1 per bushel on foreign wheat, which currently sells at the world price of $4 per bushel. Your Graph Score: 0% Price (S) CS 10 PS DWL2 DWL CS World price 20 40 60 80 100 120 140 160 180 Quantity of wheat (millions) a. Use the tool provided (CS) to draw the consumer surplus...
 3. Refer to the figure. The United States is currently open to international trade in the market of basketballs, but domestic producers are lobbying to ban the importation of basketballs from abroad for national security reasons. Domestic producers claim that they are unable to compete with foreign producers based on price and that eventually they would be forced to close their shops domestically. This would give foreign producers the power to cut off the supply of basketballs to the United...
 1) The United States sugar industry has enjoyed trade protection for several years. As a result, sugar prices in the U.S. are higher than the average world price. Suppose that the domestic demand and domestic supply for sugar are as provided in the table below (assume continuous, linear domestic demand and supply curves which include the following data points for sugar): | Price ($ per Quantity Demanded Domestically Quantity Supplied Domestically pound) (Millions of Pounds per Year) (Millions of Pounds...
 INTERNATIONAL TRADE WORKSHEET 2 Below, you are provided with the demand and supply curves for orange juice. You will use this information to identify whether the country imports or exports orange juice. You will also determine whether producers and/or consumers win by engaging in international trade. $7 Price (per gallon) $6 Supply $5 $4 $3 $2 $1 Demand 30 60 210 90 120 150 180 Quantity of Orange Juice (in gallons) Part 1: Suppose that the country depicted above does...
 Consider the market for wheat, depicted in the figure to the right Suppose a price floor of government is imposed by the As a result of the price floor there is a of wheat Compared with the market clearing equilibrium, is the price floor efficient? What are represents the loss in efficiency in terms of consumer and producer surplus resulting from the price floor? Use the triangle drawing tool to shade in deadweight loss Label this shaded area Deadweight Loss...
 7. Problems and Applications Q7 Congress and the president decide that the United States should reduce air pollution by reducing its use of gasoline. They impose a $0.50 tax on each gallon of gasoline sold. Suppose they decided to impose the tax on producers. In the following graph, shows the effect of a $0.50 tax on each gallon of gasoline sold imposed on producers by shifting the demand or supply curve. Supply Demand Supply Price of Gasoline (Dollars per gallon)...
 please only do problem d e and f
thanks!
1) The United States sugar industry has enjoyed trade protection for several years. As a result, sugar prices in the U.S. are higher than the average world price. Suppose that the domestic demand and domestic supply for sugar are as provided in the table below (assume continuous, linear domestic demand and supply curves which include the following data points for sugar): | Price ($ per Quantity Demanded Domestically Quantity Supplied Domestically...
please only do problem d e and f
thanks!
1) The United States sugar industry has enjoyed trade protection for several years. As a result, sugar prices in the U.S. are higher than the average world price. Suppose that the domestic demand and domestic supply for sugar are as provided in the table below (assume continuous, linear domestic demand and supply curves which include the following data points for sugar): | Price ($ per Quantity Demanded Domestically Quantity Supplied Domestically...
Most questions answered within 3 hours.
-
Where is the error in this code sequence?
String s1 = "Hello";
String s2 = "ello";...
asked 11 months ago -
Financial data for Joel de Paris, Inc., for last year
follow:
Joel de Paris, Inc.
Balance...
asked 11 months ago -
Consider this reaction:
Al2(SO4)3 (aq)+ BaCl3
(aq) Al2Cl6 (aq)- +
3BaSO4(s) . What is the...
asked 11 months ago -
Suppose that Savneet is considering increasing her
recent random sample from 20 car rentals to 40...
asked 11 months ago -
Trucks arrive at an unloading terminal at an average rate of 120
per hour.
Trucks arrive...
asked 11 months ago -
Why are methanol and ethanol completely soluble in water while
octanol is not very little soluble....
asked 11 months ago -
A facilities manager at a university reads in a research report
that the mean amount of...
asked 11 months ago -
When the CuSO4 is rehydrated by adding water to the anhydrous
compound, is this an endothermic...
asked 11 months ago -
A ray of sunlight is passing from diamond into crown glass; the
angle of incidence is...
asked 11 months ago -
A block of mass 0.249 kg is placed on top of a light, vertical
spring of...
asked 11 months ago -
how do the kidneys compensate in the presences of acidosis
a) trigger hyperventilate
b) reserve acid...
asked 11 months ago -
Question 501 pts
The rental rate of capital to the firm increases. Which of the
following...
asked 11 months ago