

Homework Answers
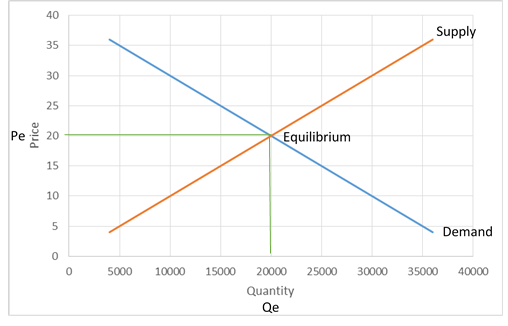
The information from table 1 is drawn in the graph below. Pe and Qe are equilibrium price and quantity. Pe = 20 and Qe = 20000.
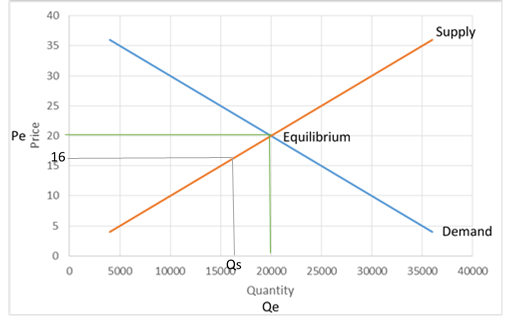
- At Price = 16, quantity supplied is given by Qs in the graph. Qs = 16000.
b) At Price = 16, quantity demanded is given by Qd in the graph. Qd = 24000.
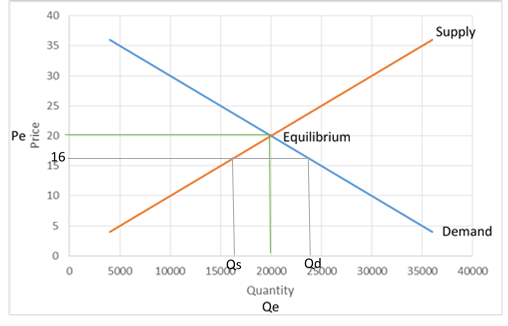
c) At price 16, quantity demanded greater than quantity supplied. This situation is called shortage as there is shortage of supply given demand.
d) Change in price does not shift demand or supply. It leads to movement along the curve. Price, the determinant of demand and supply changed here.
e) If price = 16, there will be shortage in the market. More people would want to buy than is available. People will be willing to pay more to get the good. The price will rise. The adjustment will continue till demand equals supply. Here, price will rise till 20, as there demand equals supply.
two ways of looking at GDP are - expenditure approach and income approach. Both approaches give the same result.
Add Answer to:
EC 2113 - Principles of Macroeconomics Professor: Dr. Heriberto Gonzalez Table 1 Price Idollars Quantity Quantity...
Suppose the following table represents the market demand and supply: Price per apple (P) Quantity demanded...
 Suppose the following table represents the market demand and supply: Price per apple (P) Quantity demanded ( $2 $4.5 $8 Quantity supplied (Q) 10 35 70 64 16 a (10 points) Calculate the linear demand function: Q-a -bP. Draw the linear demand in a graph with price in the vertical axis and quantity demanded in the horizontal axis. Label all points including the intercept terms. Calculate the slope of the linear demand function What is the economic meaning of the...
The following table contains information about the wheat market: Price per Bushel (dollars) Quantity Demanded (bushels)...
The following table contains information about the wheat market: Price per Bushel (dollars) Quantity Demanded (bushels) Quantity Supplied (bushels) $2 40,000 0 4 34,000 4,000 6 28,000 8,000 8 24,000 16,000 10 20,000 20,000 12 18,000 28,000 14 12,000 36,000 16 6,000 40,000 Draw and label a graph representing this market (demand curve, supply curve, etc.) What is the market price of wheat in this market, and what is the total revenue to farmers at that price? If the...
Using the Supply and Demand Schedules to answer the following questions Table 1 Quantity Quantity Supplied...
 Using the Supply and Demand Schedules to answer the following questions Table 1 Quantity Quantity Supplied Demand Price 100 30 70 200 40 60 300 50 50 40 400 60 500 70 30 600 80 20 3a. Draw the Supply and Demand graph and label. Show the area for the shortage, surplus, and market equilibrium point demand curve to list inan of ft tw lis determinants of the supply curve to shift outward.
Using the Supply and Demand Schedules to...
Using the Supply and Demand Schedules to answer the following questions Table 1 Quantity Quantity Supplied Demand Price 100 30 70 200 40 60 300 50 50 40 400 60 500 70 30 600 80 20 3a. Draw the Supply and Demand graph and label. Show the area for the shortage, surplus, and market equilibrium point demand curve to list inan of ft tw lis determinants of the supply curve to shift outward.
Using the Supply and Demand Schedules to...
Need help please, 1. Interpret the following statement: "An increase in the price of wheat will...
Need help please, 1. Interpret the following statement: "An increase in the price of wheat will encourage farmers to increase the quantity of wheat supplied to the market." A The statement would be correct if "quantity of wheat demanded" were substituted for "quantity of wheat supplied." B The statement is incorrect because it confuses a change in quantity supplied with a change in supply. C The statement would be correct if it read that a "decrease in the price of...
Initial Market Information: -Equilibrium Price: $1,000 -Equilibrium Quantity: 500 pairs of shoes Directions: A) Draw and...
Initial Market Information: -Equilibrium Price: $1,000 -Equilibrium Quantity: 500 pairs of shoes Directions: A) Draw and graph the initial market information provided in a supply and demand framework on the following grapp Immediately after the shift, and at the initial equilibrium price ($1,000) quantity demanded (QD) is 1,000 pairs of shoes on the new demand curve (D1) -Some time after the shift the forces of supply and demand equilibrate the market at a price of $1,500 and a quantity of...
Macroeconomics d. Did the increase in production costs cause a "decrease in supply" or a "decrease...
 Macroeconomics
d. Did the increase in production costs cause a "decrease in supply" or a "decrease in quantity supplied"? 3. Refer to the following expanded table from review question 8. LO3.4 a. What is the equilibrium price? At what price is there neither a shortage nor a surplus? Fill in the surplus-shortage column and use it to confirm your answers. b. Graph the demand for wheat and the supply of wheat. Be sure to label the axes of your graph...
Macroeconomics
d. Did the increase in production costs cause a "decrease in supply" or a "decrease in quantity supplied"? 3. Refer to the following expanded table from review question 8. LO3.4 a. What is the equilibrium price? At what price is there neither a shortage nor a surplus? Fill in the surplus-shortage column and use it to confirm your answers. b. Graph the demand for wheat and the supply of wheat. Be sure to label the axes of your graph...
3. The market for pizza has the following demand and supply schedules: Price 5 Quantity Demanded...
3. The market for pizza has the following demand and supply schedules:PriceQuantity DemandedQuantity Supplied$4135 pizzas26 pizzas5104536818176898853110939121a. (0.4 pt) Graph the demand and supply curves. What is the equilibrium price and equilibrium quantity in this market? (Make sure to label the axes.)b. (0.2 pt) If the actual price in this market was below the equilibrium price, what would result? Then, what would drive the market toward the equilibrium?c. (0.2 pt) If the actual price in this market was above the equilibrium...
Please help with these questions, 1. The price where quantity demanded is equal to quantity supplied...
Please help with these questions, 1. The price where quantity demanded is equal to quantity supplied is known as Use letters in alphabetical order to select options A equilibrium rate. B equilibrium price. C equilibrium quantity. D equilibrium level. 2. Fill in the blank with the correct answer by typing in the box. A _______ shows the relationship between price and quantity demanded on a graph. 3. Select whether the statement is true or false. The point where the supply...
1. Using the following data: Price in $ Quantity demanded Quantity supplied 20 a) Find equilibrium...
 1. Using the following data: Price in $ Quantity demanded Quantity supplied 20 a) Find equilibrium P, Q. b) On one graph, graph both the demand and supply curves. c) If price was fixed at $10, what would be the result? d) If quantity supplied increases by 5 at every price level due to better technology and quantity demanded decreases by 5 at every price level due to lower incomes, what would be the new equilibrium P, Q?
1. Suppose the total demand for wheat and the total supply of wheat per month in...
 1. Suppose the total demand for wheat and the total supply of wheat per month in the Kansas City grain market are as shown in the table below. Thousands of Bushels Demanded Price Thousands of Bushels Supplied 85 $3. 70 80 $ 4 80 75 $ 5 90 70 $6 100 65 $ 7 110 60 $ 8 120 a. What is the equilibrium price? b. At what price is there neither a shortage nor a surplus? c. Fill in...
 Suppose the following table represents the market demand and supply: Price per apple (P) Quantity demanded ( $2 $4.5 $8 Quantity supplied (Q) 10 35 70 64 16 a (10 points) Calculate the linear demand function: Q-a -bP. Draw the linear demand in a graph with price in the vertical axis and quantity demanded in the horizontal axis. Label all points including the intercept terms. Calculate the slope of the linear demand function What is the economic meaning of the...
 Using the Supply and Demand Schedules to answer the following questions Table 1 Quantity Quantity Supplied Demand Price 100 30 70 200 40 60 300 50 50 40 400 60 500 70 30 600 80 20 3a. Draw the Supply and Demand graph and label. Show the area for the shortage, surplus, and market equilibrium point demand curve to list inan of ft tw lis determinants of the supply curve to shift outward.
Using the Supply and Demand Schedules to...
Using the Supply and Demand Schedules to answer the following questions Table 1 Quantity Quantity Supplied Demand Price 100 30 70 200 40 60 300 50 50 40 400 60 500 70 30 600 80 20 3a. Draw the Supply and Demand graph and label. Show the area for the shortage, surplus, and market equilibrium point demand curve to list inan of ft tw lis determinants of the supply curve to shift outward.
Using the Supply and Demand Schedules to...
 Macroeconomics
d. Did the increase in production costs cause a "decrease in supply" or a "decrease in quantity supplied"? 3. Refer to the following expanded table from review question 8. LO3.4 a. What is the equilibrium price? At what price is there neither a shortage nor a surplus? Fill in the surplus-shortage column and use it to confirm your answers. b. Graph the demand for wheat and the supply of wheat. Be sure to label the axes of your graph...
Macroeconomics
d. Did the increase in production costs cause a "decrease in supply" or a "decrease in quantity supplied"? 3. Refer to the following expanded table from review question 8. LO3.4 a. What is the equilibrium price? At what price is there neither a shortage nor a surplus? Fill in the surplus-shortage column and use it to confirm your answers. b. Graph the demand for wheat and the supply of wheat. Be sure to label the axes of your graph...
 1. Using the following data: Price in $ Quantity demanded Quantity supplied 20 a) Find equilibrium P, Q. b) On one graph, graph both the demand and supply curves. c) If price was fixed at $10, what would be the result? d) If quantity supplied increases by 5 at every price level due to better technology and quantity demanded decreases by 5 at every price level due to lower incomes, what would be the new equilibrium P, Q?
 1. Suppose the total demand for wheat and the total supply of wheat per month in the Kansas City grain market are as shown in the table below. Thousands of Bushels Demanded Price Thousands of Bushels Supplied 85 $3. 70 80 $ 4 80 75 $ 5 90 70 $6 100 65 $ 7 110 60 $ 8 120 a. What is the equilibrium price? b. At what price is there neither a shortage nor a surplus? c. Fill in...
Most questions answered within 3 hours.
-
Where is the error in this code sequence?
String s1 = "Hello";
String s2 = "ello";...
asked 11 months ago -
Financial data for Joel de Paris, Inc., for last year
follow:
Joel de Paris, Inc.
Balance...
asked 11 months ago -
Consider this reaction:
Al2(SO4)3 (aq)+ BaCl3
(aq) Al2Cl6 (aq)- +
3BaSO4(s) . What is the...
asked 11 months ago -
Suppose that Savneet is considering increasing her
recent random sample from 20 car rentals to 40...
asked 11 months ago -
Trucks arrive at an unloading terminal at an average rate of 120
per hour.
Trucks arrive...
asked 11 months ago -
Why are methanol and ethanol completely soluble in water while
octanol is not very little soluble....
asked 11 months ago -
A facilities manager at a university reads in a research report
that the mean amount of...
asked 11 months ago -
When the CuSO4 is rehydrated by adding water to the anhydrous
compound, is this an endothermic...
asked 11 months ago -
A ray of sunlight is passing from diamond into crown glass; the
angle of incidence is...
asked 11 months ago -
A block of mass 0.249 kg is placed on top of a light, vertical
spring of...
asked 11 months ago -
how do the kidneys compensate in the presences of acidosis
a) trigger hyperventilate
b) reserve acid...
asked 11 months ago -
Question 501 pts
The rental rate of capital to the firm increases. Which of the
following...
asked 11 months ago