

Homework Answers
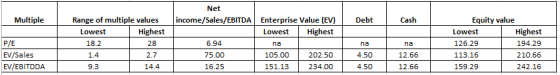
Formulas: Enterprise value = (EV/Sales multiple)*Ideko Sales
Enterprise value = (EV/EBITDA multiple)*Ideko EBITDA
Equity value Enterprise value - debt + cash
(Note: Only excess cash has to be considered here. Since only balance sheet is provided, we assume that all cash mentioned can be taken as excess cash.)
Equity value = (P/E multiple)*Ideko net income
The range of acquisition prices for Ideko is from 113.16 million to 242.16 million. Please note that for deciding upon a value, further analysis of the target's operations and cash flows needs to be done. Relative valuation is, at best, an indicator of the value.
Add Answer to:
Valuation by Comparables Problem What range of acquisition prices for Ideko is implied by the range...
Assume that Ideko's market share after 2005 will increase each year, the required production volume for...
Assume that Ideko's market share after 2005 will increase each year, the required production volume for the following five years are shown here: Sales Date Growth rate Market Size (000 units) 5.00% Market Share 0.50% Production Value (000 units) Ideko's [roduction plant will require an expansion in 2010 (where production volume will exceed the current level by 50%). and the cost of this expansion will be 15.0 million. Assuming the financing of the expansion will be delayed accordingly, calculate the...
Pro Forma Income Statement for Ideko, 2010-2015 2013 2014 2015 2012 Year 2010 2011 Income Statement...
 Pro Forma Income Statement for Ideko, 2010-2015 2013 2014 2015 2012 Year 2010 2011 Income Statement ($ 000) 103,234 119,777 138,149 158,526 75,000 88,358 1 Sales 2 Cost of Goods Sold (16,000) (18,665) (21,593) (24,808) (28,333) (32,193) (18,000) (21,622) (25,757) (30,471) (35,834) (41,925) 64,498 3 Raw Materials 4 Direct Labor Costs 84,407 73,982 5 Gross Profit 41,000 48,071 55,883 6 Sales and Marketing (11,250) (14,579) (18,582) (23,356) (27,630) (31,705) (13,500) (13,254) (15,485) (16,769) (17,959) (20,608) 21,816 7 Administrative 8 EBITDA...
Use the tables for the question(s) below. tions Pro Forma Income Statement for Ideko, 2010-2015 Year...
 Use the tables for the question(s) below. tions Pro Forma Income Statement for Ideko, 2010-2015 Year 2010 2011 2012 2013 2014 2015 Income Statement ($ 000) 1 Sales 75,000 88,358 103,234 119,777 138,149 158,526 2 Cost of Goods Sold 3 Raw Materials (16,000) (18,665) (21,593) (24,808) (28,333) (32,193) 4 Direct Labor Costs (18,000) (21,622) (25,757) (30,471) (35,834) (41,925) 5 Gross Profit 41,000 $8,071 55,883 64,498 73,982 84,407 6 Sales and Marketing (11,250) (14,579) (18,582) (23,356) (27,630) (31,705) 7 Administrative (13,500)...
Jim's Espresso expects sales to grow by 10.0% next year. Assume that Jim's pays out 90%...
Jim's Espresso expects sales to grow by 10.0% next year. Assume that Jim's pays out 90% of its net income. Use the following statements and the percent of sales method to forecast: a. Stockholders' equity b. Accounts payable The Tax Cuts and Jobs Act of 2017 temporarily allows 100% bonus depreciation (effectively expensing capital expenditures). However, we will still include depreciation forecasting in this chapter and in these problems in anticipation of the return of standard depreciation practices during your...
P 18-5 (similar to) Question Help Jim's Espresso expects sales to grow by 9.5% next year....
 P 18-5 (similar to) Question Help Jim's Espresso expects sales to grow by 9.5% next year. Assume that Jim's pays out 80.3% of its net income. Use the following statements and the percent of sales method to forecast: a. Stockholders' equity b. Accounts payable The Tax Cuts and Jobs Act of 2017 temporarily allows 100% bonus depreciation (effectively expensing capital expenditures). However, we will still include depreciation forecasting in this chapter and in these problems in anticipation of the return...
Please show all steps and work. Any help will be appreciated and thank you for your...
 Please show all steps and work. Any help will be appreciated and
thank you for your time!
Consider the financial statements for Nano Networks, Inc. The closing stock price for Nano Network was $56.67 (split adjusted) on December 31, 2005. On the basis of the financial data presented, compute the various financial ratios and make an informed analysis of Nano's financial health. . Debt ratio 2. Times-interest-earned ratio 3. Current ratio 4. Quick (acid-test) ratio 5. Inventory turnover ratio 6....
Please show all steps and work. Any help will be appreciated and
thank you for your time!
Consider the financial statements for Nano Networks, Inc. The closing stock price for Nano Network was $56.67 (split adjusted) on December 31, 2005. On the basis of the financial data presented, compute the various financial ratios and make an informed analysis of Nano's financial health. . Debt ratio 2. Times-interest-earned ratio 3. Current ratio 4. Quick (acid-test) ratio 5. Inventory turnover ratio 6....
2.4 The balance sheet that follows summarizes the financial conditions for Flex, Inc., an electronic outsourcing...
 2.4 The balance sheet that follows summarizes the financial conditions for Flex, Inc., an electronic outsourcing contractor, for fiscal-year 2005. Unlike Nano Network Corporation in Problem 2.3, Flex has reported a profit for several years running. Compute the various financial ratios and interpret the firm's financial health dur- ing fiscal-year 2005. Aug. 2005 Aug. 2004 U.S. $ (000) U.S. $ (000) (12 mos.) (Year) Balance Sheet Summary Cash Securities Receivables Allowances Inventory Current assets Property and equipment, net Depreciation Total...
Problem 12-4B Calculate risk ratios (L012-3) The following income statement and balance sheets for The Athletic...
 Problem 12-4B Calculate risk ratios (L012-3) The following income statement and balance sheets for The Athletic Attic are provided. THE ATHLETIC ATTIC Income Statement For the year ended December 31, 2021 Net sales $8,780,000 Cost of goods sold 5,390,000 Gross profit 3,390,000 Expenses: Operating expenses $1,540,000 Depreciation expense 198.000 Interest expense 38. Bee Income tax expense 348,000 Total expenses 2,124,000 Net income 31.266,000 THE ATHLETIC ATTIC Balance Sheets December 31 2021 2020 Assets Current assets: $ $ 152,000 730,000 1,345,000...
Problem 23-3 Sarasota Company has not yet prepared a formal statement of cash flows for the...
 Problem 23-3 Sarasota Company has not yet prepared a formal statement of cash flows for the 2017 fiscal year. Com parative balance sheets as of December 31, 2016 and 2017, and a statement of income and retained earnings for the year ended December 31, 2017, are presented as follows. SARASOTA COMPANY STATEMENT OF INCOME AND RETAINED EARNINGS FOR THE YEAR ENDED DECEMBER 31, 2017 ($000 OMITTED) Sales revenue $3,830 Expenses Cost of goods sold $1,190 Salaries and benefits 740 Heat,...
 Pro Forma Income Statement for Ideko, 2010-2015 2013 2014 2015 2012 Year 2010 2011 Income Statement ($ 000) 103,234 119,777 138,149 158,526 75,000 88,358 1 Sales 2 Cost of Goods Sold (16,000) (18,665) (21,593) (24,808) (28,333) (32,193) (18,000) (21,622) (25,757) (30,471) (35,834) (41,925) 64,498 3 Raw Materials 4 Direct Labor Costs 84,407 73,982 5 Gross Profit 41,000 48,071 55,883 6 Sales and Marketing (11,250) (14,579) (18,582) (23,356) (27,630) (31,705) (13,500) (13,254) (15,485) (16,769) (17,959) (20,608) 21,816 7 Administrative 8 EBITDA...
 Use the tables for the question(s) below. tions Pro Forma Income Statement for Ideko, 2010-2015 Year 2010 2011 2012 2013 2014 2015 Income Statement ($ 000) 1 Sales 75,000 88,358 103,234 119,777 138,149 158,526 2 Cost of Goods Sold 3 Raw Materials (16,000) (18,665) (21,593) (24,808) (28,333) (32,193) 4 Direct Labor Costs (18,000) (21,622) (25,757) (30,471) (35,834) (41,925) 5 Gross Profit 41,000 $8,071 55,883 64,498 73,982 84,407 6 Sales and Marketing (11,250) (14,579) (18,582) (23,356) (27,630) (31,705) 7 Administrative (13,500)...
 P 18-5 (similar to) Question Help Jim's Espresso expects sales to grow by 9.5% next year. Assume that Jim's pays out 80.3% of its net income. Use the following statements and the percent of sales method to forecast: a. Stockholders' equity b. Accounts payable The Tax Cuts and Jobs Act of 2017 temporarily allows 100% bonus depreciation (effectively expensing capital expenditures). However, we will still include depreciation forecasting in this chapter and in these problems in anticipation of the return...
 Please show all steps and work. Any help will be appreciated and
thank you for your time!
Consider the financial statements for Nano Networks, Inc. The closing stock price for Nano Network was $56.67 (split adjusted) on December 31, 2005. On the basis of the financial data presented, compute the various financial ratios and make an informed analysis of Nano's financial health. . Debt ratio 2. Times-interest-earned ratio 3. Current ratio 4. Quick (acid-test) ratio 5. Inventory turnover ratio 6....
Please show all steps and work. Any help will be appreciated and
thank you for your time!
Consider the financial statements for Nano Networks, Inc. The closing stock price for Nano Network was $56.67 (split adjusted) on December 31, 2005. On the basis of the financial data presented, compute the various financial ratios and make an informed analysis of Nano's financial health. . Debt ratio 2. Times-interest-earned ratio 3. Current ratio 4. Quick (acid-test) ratio 5. Inventory turnover ratio 6....
 2.4 The balance sheet that follows summarizes the financial conditions for Flex, Inc., an electronic outsourcing contractor, for fiscal-year 2005. Unlike Nano Network Corporation in Problem 2.3, Flex has reported a profit for several years running. Compute the various financial ratios and interpret the firm's financial health dur- ing fiscal-year 2005. Aug. 2005 Aug. 2004 U.S. $ (000) U.S. $ (000) (12 mos.) (Year) Balance Sheet Summary Cash Securities Receivables Allowances Inventory Current assets Property and equipment, net Depreciation Total...
 Problem 12-4B Calculate risk ratios (L012-3) The following income statement and balance sheets for The Athletic Attic are provided. THE ATHLETIC ATTIC Income Statement For the year ended December 31, 2021 Net sales $8,780,000 Cost of goods sold 5,390,000 Gross profit 3,390,000 Expenses: Operating expenses $1,540,000 Depreciation expense 198.000 Interest expense 38. Bee Income tax expense 348,000 Total expenses 2,124,000 Net income 31.266,000 THE ATHLETIC ATTIC Balance Sheets December 31 2021 2020 Assets Current assets: $ $ 152,000 730,000 1,345,000...
 Problem 23-3 Sarasota Company has not yet prepared a formal statement of cash flows for the 2017 fiscal year. Com parative balance sheets as of December 31, 2016 and 2017, and a statement of income and retained earnings for the year ended December 31, 2017, are presented as follows. SARASOTA COMPANY STATEMENT OF INCOME AND RETAINED EARNINGS FOR THE YEAR ENDED DECEMBER 31, 2017 ($000 OMITTED) Sales revenue $3,830 Expenses Cost of goods sold $1,190 Salaries and benefits 740 Heat,...
Most questions answered within 3 hours.
-
Where is the error in this code sequence?
String s1 = "Hello";
String s2 = "ello";...
asked 10 months ago -
Financial data for Joel de Paris, Inc., for last year
follow:
Joel de Paris, Inc.
Balance...
asked 10 months ago -
Consider this reaction:
Al2(SO4)3 (aq)+ BaCl3
(aq) Al2Cl6 (aq)- +
3BaSO4(s) . What is the...
asked 10 months ago -
Suppose that Savneet is considering increasing her
recent random sample from 20 car rentals to 40...
asked 10 months ago -
Trucks arrive at an unloading terminal at an average rate of 120
per hour.
Trucks arrive...
asked 10 months ago -
Why are methanol and ethanol completely soluble in water while
octanol is not very little soluble....
asked 10 months ago -
A facilities manager at a university reads in a research report
that the mean amount of...
asked 10 months ago -
When the CuSO4 is rehydrated by adding water to the anhydrous
compound, is this an endothermic...
asked 10 months ago -
A ray of sunlight is passing from diamond into crown glass; the
angle of incidence is...
asked 10 months ago -
A block of mass 0.249 kg is placed on top of a light, vertical
spring of...
asked 10 months ago -
how do the kidneys compensate in the presences of acidosis
a) trigger hyperventilate
b) reserve acid...
asked 10 months ago -
Question 501 pts
The rental rate of capital to the firm increases. Which of the
following...
asked 10 months ago