
Homework Answers
Answer #1
Problem 3:
| Grants Categories | Grant Contributions |
| Camden, N.J. | $13,36,700.00 |
| Plant communities | $34,500.00 |
| Dollars for Doers | $1,79,600.00 |
| Other Projects | $64,100.00 |
| Total | $16,14,900.00 |
The pie chart calculation for each grant is done using

For example, for Camden N.J. =  = 82.7%
  83%
83%
Summarization of Grants
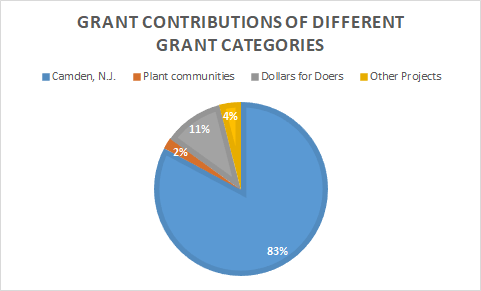
The pie chart shows that the maximum grant contribution is done by Camden N.J. contributing the highest grants as 83% of the total grants. Followed by Dollars for Doers, where the pie chart has 11% of total grants and the least contribution is made by Other Projects comprising 2% of total grants. Whereas, 4% contribution is made by Plant Communities from the total grants.
GRANT CONTRIBUTIONS OF DIFFERENT GRANT CATEGORIES I Dollars for Doers ICamden, N.J. Plant communities 1Other Projects 4% 11% 2% 83%
We were unable to transcribe this image
We were unable to transcribe this image
We were unable to transcribe this image
Know the answer?
Add Answer to:
Problem 3: During 2001, the Campbell Soup Foundation provided the following amounts in grants: Camden, N.L.....
Not the answer you're looking for?
Ask your own homework help question.
Our experts will answer your question WITHIN MINUTES for Free.
Similar Homework Help Questions
ADVERTISEMENT
Need Online Homework Help?
Ask
a QuestionGet Answers For Free
Most questions answered within 3 hours.
Most questions answered within 3 hours.
ADVERTISEMENT
Active Questions
-
Where is the error in this code sequence?
String s1 = "Hello";
String s2 = "ello";...
asked 10 months ago -
Financial data for Joel de Paris, Inc., for last year
follow:
Joel de Paris, Inc.
Balance...
asked 10 months ago -
Consider this reaction:
Al2(SO4)3 (aq)+ BaCl3
(aq) Al2Cl6 (aq)- +
3BaSO4(s) . What is the...
asked 10 months ago -
Suppose that Savneet is considering increasing her
recent random sample from 20 car rentals to 40...
asked 10 months ago -
Trucks arrive at an unloading terminal at an average rate of 120
per hour.
Trucks arrive...
asked 10 months ago -
Why are methanol and ethanol completely soluble in water while
octanol is not very little soluble....
asked 10 months ago -
A facilities manager at a university reads in a research report
that the mean amount of...
asked 10 months ago -
When the CuSO4 is rehydrated by adding water to the anhydrous
compound, is this an endothermic...
asked 10 months ago -
A ray of sunlight is passing from diamond into crown glass; the
angle of incidence is...
asked 10 months ago -
A block of mass 0.249 kg is placed on top of a light, vertical
spring of...
asked 10 months ago -
how do the kidneys compensate in the presences of acidosis
a) trigger hyperventilate
b) reserve acid...
asked 10 months ago -
Question 501 pts
The rental rate of capital to the firm increases. Which of the
following...
asked 10 months ago
ADVERTISEMENT