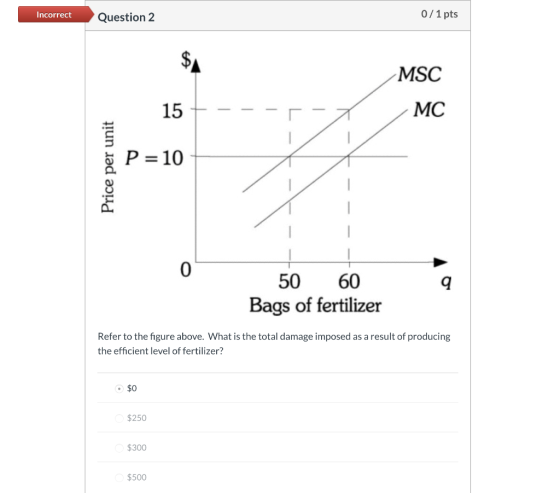
Refer to the figure above. What is the total damage imposed as a result of producing the efficient level of fertilizer?
Homework Answers
There are two cost production cost and damage.
At efficient outcome equal to 50.
The total damage cost=per unit damage cost* efficient outcome=5*50=250
Option B is right.
Note:Even firm producing efficient level of fertilizer but the damage cost didn't vanish .it still occuring.
Due to efficent level of outcome ,the deadweight loss vanished ( loss of surplus).
Add Answer to:
Refer to the figure above. What is the total damage imposed as a
result of producing...
Refer to the figure below. If the firm is producing the level of output that maximizes profit, its total variable c...
 Refer to the figure below. If the firm is producing the level of output that maximizes profit, its total variable cost of production is: Price (s) MC1 Fatci AVC NA MRID 10 20 30 40 50 60 70 80 90 Quantity $240 $420 $360 $160
Refer to the information provided in Figure 8.6 below to answer the questions that follow. Cost...
 Refer to the information provided in Figure 8.6 below to answer the questions that follow. Cost curves for Outdoor Equipment 1 B 3 Cost per unit 2 A Number of sleeping bags 9 Figure 8.6 Refer to Figure 8.6. Curve 1 is Outdoor Equipment's cost curve. average variable marginal average fixed average total Refer to the information provided in Figure 13.9 below to answer the questions that follow. $A A G B Dollars E C MC = AC D MR...
27 2$ Refer to the diagram below. Price $13 Domestic Supply 00 $1.00 Tarih ) un...
 27 2$ Refer to the diagram below. Price $13 Domestic Supply 00 $1.00 Tarih ) un World Price Domestic Demand 30 40 60 84 96 Quantity Assuming that an import quota is given to foreign producers for free. What would be the total revenue received by foreign producers if an import quota is imposed instead of a $1 per unit tariff? 00 $1.00 Tariff 10 World Price Domestic Demand 30 40 60 84 96 Quantity Assuming that an import quota...
6 of 17 Refer to the figure below. If the firm is producing the level of...
 6 of 17 Refer to the figure below. If the firm is producing the level of output that maximizes profit, its total variable cost of production is (Hint: after finding the profit-maximizing point, you are looking for an area created by the average variable cost curve) Price ($) 18 16 MC1 14 12 10 ATC: 8 6 AVC1 4 का a 2 MR Di 10 20 30 40 50 60 70 80 90 Quantity $240 $360 $420 S160
1. Refer to Figure 1-5. The figure above represents demand and supply in the market for...
 1. Refer to Figure 1-5. The figure above represents demand and
supply in the market for cigarettes. Use the diagram to answer the
following questions.
a. How much is the government tax on each pack of
cigarettes?
b. What portion of the unit tax is paid by consumers?
c. What portion of the unit tax is paid by producers?
d. What is the quantity sold after the imposition of the
tax?
e. What is the after-tax revenue per pack received...
1. Refer to Figure 1-5. The figure above represents demand and
supply in the market for cigarettes. Use the diagram to answer the
following questions.
a. How much is the government tax on each pack of
cigarettes?
b. What portion of the unit tax is paid by consumers?
c. What portion of the unit tax is paid by producers?
d. What is the quantity sold after the imposition of the
tax?
e. What is the after-tax revenue per pack received...
29. The following figure shows the demand curve faced by a monopolist. Refer to the figure...
29. The following figure shows the demand curve faced by a monopolist. Refer to the figure above. What is the change in total revenue due to a price decrease from $4 to $3? a. Total revenue decreases by $200. b. Total revenue increases by $100. c. Total revenue decreases by $100. d. Total revenue dinreases by $200. 30. Which of the following is true of an increase in product prices? a. When the quantity effect dominates the price effect, total...
Refer to the graph below. What price should the firm charge in order to maximize profits?...
 Refer to the graph below. What price should the firm charge in order to maximize profits? P 1 $70 I -1.J.-L III $60 $50 $40 $30 ור-זי N-T 1 I MC.. 1 $20 0 HT 1---T $10 --רוז--ו--י-ז-יח 1 1 1 1 1 + MR ----De 50 100 150 200 250 300 350 400 450 500 550 1 1
The following is a total cost curve. 1000, Total cost ($) 0 50 100 150 200...
 The following is a total cost curve. 1000, Total cost ($) 0 50 100 150 200 250 300 350 Quantity (9) On the diagram to the right, sketch the corresponding marginal cost curve. Marginal cost per unit ($) Using the multipoint curved line drawing tool, draw the firm's marginal cost curve. Label this curve 'MC'. Note: Use the multipoint curved line drawing tool one time to draw the entire curve. If the price of output is $3.00 and there are...
Refer to the table above. Suppose the government wants to reduce the total amount of pollution...
 Refer to the table above. Suppose the government wants to reduce
the total amount of pollution from the current level of 10 to 4. To
do this, the government caps each firm's emissions at 2 units and
issues 2 permits to each firm. If firms are not allowed to trade
permits, what is the total cost of the pollution reduction?
Question 1 1 pts Table 16.3 Firm A Firm A Firm B Firm B Reduction of Pollution by Firm A...
Refer to the table above. Suppose the government wants to reduce
the total amount of pollution from the current level of 10 to 4. To
do this, the government caps each firm's emissions at 2 units and
issues 2 permits to each firm. If firms are not allowed to trade
permits, what is the total cost of the pollution reduction?
Question 1 1 pts Table 16.3 Firm A Firm A Firm B Firm B Reduction of Pollution by Firm A...
The graph is below. 6. Refer to Figure 15-6. What area measures the monopolist’s profit? (K-C)*W (L-A)*T (K-B)*W 0.5[(K-C)*(Z-T)] download?verifier=kMtVtwZuG9vNA64o3Itl3r 20. Scenario 15-3 A monopoly firm maximizes its profit by producing Q = 500
 The graph is below.6.Refer to Figure 15-6. What area measures the
monopolist’s profit?(K-C)*W(L-A)*T(K-B)*W0.5[(K-C)*(Z-T)]20.Scenario 15-3A monopoly firm maximizes its profit by producing Q = 500 units of
output. At that level of output, its marginal revenue is $30, its
average revenue is $60, and its average total cost is $34.Refer to Scenario 15-3. At Q = 500, the firm's
profit is-$13,000.-$15,000.-$17,000.-$30,000.21.21. Refer to Figure 15-9. To maximize total
surplus, a benevolent social planner would choose which of the
following outcomes?-100 units...
The graph is below.6.Refer to Figure 15-6. What area measures the
monopolist’s profit?(K-C)*W(L-A)*T(K-B)*W0.5[(K-C)*(Z-T)]20.Scenario 15-3A monopoly firm maximizes its profit by producing Q = 500 units of
output. At that level of output, its marginal revenue is $30, its
average revenue is $60, and its average total cost is $34.Refer to Scenario 15-3. At Q = 500, the firm's
profit is-$13,000.-$15,000.-$17,000.-$30,000.21.21. Refer to Figure 15-9. To maximize total
surplus, a benevolent social planner would choose which of the
following outcomes?-100 units...
 Refer to the figure below. If the firm is producing the level of output that maximizes profit, its total variable cost of production is: Price (s) MC1 Fatci AVC NA MRID 10 20 30 40 50 60 70 80 90 Quantity $240 $420 $360 $160
 Refer to the information provided in Figure 8.6 below to answer the questions that follow. Cost curves for Outdoor Equipment 1 B 3 Cost per unit 2 A Number of sleeping bags 9 Figure 8.6 Refer to Figure 8.6. Curve 1 is Outdoor Equipment's cost curve. average variable marginal average fixed average total Refer to the information provided in Figure 13.9 below to answer the questions that follow. $A A G B Dollars E C MC = AC D MR...
 27 2$ Refer to the diagram below. Price $13 Domestic Supply 00 $1.00 Tarih ) un World Price Domestic Demand 30 40 60 84 96 Quantity Assuming that an import quota is given to foreign producers for free. What would be the total revenue received by foreign producers if an import quota is imposed instead of a $1 per unit tariff? 00 $1.00 Tariff 10 World Price Domestic Demand 30 40 60 84 96 Quantity Assuming that an import quota...
 6 of 17 Refer to the figure below. If the firm is producing the level of output that maximizes profit, its total variable cost of production is (Hint: after finding the profit-maximizing point, you are looking for an area created by the average variable cost curve) Price ($) 18 16 MC1 14 12 10 ATC: 8 6 AVC1 4 का a 2 MR Di 10 20 30 40 50 60 70 80 90 Quantity $240 $360 $420 S160
 1. Refer to Figure 1-5. The figure above represents demand and
supply in the market for cigarettes. Use the diagram to answer the
following questions.
a. How much is the government tax on each pack of
cigarettes?
b. What portion of the unit tax is paid by consumers?
c. What portion of the unit tax is paid by producers?
d. What is the quantity sold after the imposition of the
tax?
e. What is the after-tax revenue per pack received...
1. Refer to Figure 1-5. The figure above represents demand and
supply in the market for cigarettes. Use the diagram to answer the
following questions.
a. How much is the government tax on each pack of
cigarettes?
b. What portion of the unit tax is paid by consumers?
c. What portion of the unit tax is paid by producers?
d. What is the quantity sold after the imposition of the
tax?
e. What is the after-tax revenue per pack received...
 Refer to the graph below. What price should the firm charge in order to maximize profits? P 1 $70 I -1.J.-L III $60 $50 $40 $30 ור-זי N-T 1 I MC.. 1 $20 0 HT 1---T $10 --רוז--ו--י-ז-יח 1 1 1 1 1 + MR ----De 50 100 150 200 250 300 350 400 450 500 550 1 1
 The following is a total cost curve. 1000, Total cost ($) 0 50 100 150 200 250 300 350 Quantity (9) On the diagram to the right, sketch the corresponding marginal cost curve. Marginal cost per unit ($) Using the multipoint curved line drawing tool, draw the firm's marginal cost curve. Label this curve 'MC'. Note: Use the multipoint curved line drawing tool one time to draw the entire curve. If the price of output is $3.00 and there are...
 Refer to the table above. Suppose the government wants to reduce
the total amount of pollution from the current level of 10 to 4. To
do this, the government caps each firm's emissions at 2 units and
issues 2 permits to each firm. If firms are not allowed to trade
permits, what is the total cost of the pollution reduction?
Question 1 1 pts Table 16.3 Firm A Firm A Firm B Firm B Reduction of Pollution by Firm A...
Refer to the table above. Suppose the government wants to reduce
the total amount of pollution from the current level of 10 to 4. To
do this, the government caps each firm's emissions at 2 units and
issues 2 permits to each firm. If firms are not allowed to trade
permits, what is the total cost of the pollution reduction?
Question 1 1 pts Table 16.3 Firm A Firm A Firm B Firm B Reduction of Pollution by Firm A...
 The graph is below.6.Refer to Figure 15-6. What area measures the
monopolist’s profit?(K-C)*W(L-A)*T(K-B)*W0.5[(K-C)*(Z-T)]20.Scenario 15-3A monopoly firm maximizes its profit by producing Q = 500 units of
output. At that level of output, its marginal revenue is $30, its
average revenue is $60, and its average total cost is $34.Refer to Scenario 15-3. At Q = 500, the firm's
profit is-$13,000.-$15,000.-$17,000.-$30,000.21.21. Refer to Figure 15-9. To maximize total
surplus, a benevolent social planner would choose which of the
following outcomes?-100 units...
The graph is below.6.Refer to Figure 15-6. What area measures the
monopolist’s profit?(K-C)*W(L-A)*T(K-B)*W0.5[(K-C)*(Z-T)]20.Scenario 15-3A monopoly firm maximizes its profit by producing Q = 500 units of
output. At that level of output, its marginal revenue is $30, its
average revenue is $60, and its average total cost is $34.Refer to Scenario 15-3. At Q = 500, the firm's
profit is-$13,000.-$15,000.-$17,000.-$30,000.21.21. Refer to Figure 15-9. To maximize total
surplus, a benevolent social planner would choose which of the
following outcomes?-100 units...
Most questions answered within 3 hours.
-
Where is the error in this code sequence?
String s1 = "Hello";
String s2 = "ello";...
asked 11 months ago -
Financial data for Joel de Paris, Inc., for last year
follow:
Joel de Paris, Inc.
Balance...
asked 11 months ago -
Consider this reaction:
Al2(SO4)3 (aq)+ BaCl3
(aq) Al2Cl6 (aq)- +
3BaSO4(s) . What is the...
asked 11 months ago -
Suppose that Savneet is considering increasing her
recent random sample from 20 car rentals to 40...
asked 11 months ago -
Trucks arrive at an unloading terminal at an average rate of 120
per hour.
Trucks arrive...
asked 11 months ago -
Why are methanol and ethanol completely soluble in water while
octanol is not very little soluble....
asked 11 months ago -
A facilities manager at a university reads in a research report
that the mean amount of...
asked 11 months ago -
When the CuSO4 is rehydrated by adding water to the anhydrous
compound, is this an endothermic...
asked 11 months ago -
A ray of sunlight is passing from diamond into crown glass; the
angle of incidence is...
asked 11 months ago -
A block of mass 0.249 kg is placed on top of a light, vertical
spring of...
asked 11 months ago -
how do the kidneys compensate in the presences of acidosis
a) trigger hyperventilate
b) reserve acid...
asked 11 months ago -
Question 501 pts
The rental rate of capital to the firm increases. Which of the
following...
asked 11 months ago