The manager of a gas station decided to identify his customers' demand curve for gasoline of...
The manager of a gas station decided to identify his customers' demand curve for gasoline of in order to improve the profitability of his gas station. For this reason he collected data during a three months interval of time and on this basis created the following table indicating the relationship between the price of a gallon of gasoline and the average number of gallons sold per day:
Price Number of gallons
$2.09 2143
$2.19 2081
$2.29 2097
$2.39 2006
$2.49 2011
$2.59 1987
$2.69 1937
$2.78 1901
$2.89 1915
$2.99 1924
$3.09 1870
$3.19 1822
$3.29 1767
$3.39 1725
$3.49. 1693
$3.59 1681
Taking into consideration these data,
1. present them graphically by using EXCEL Graphics
2. identify the linear demand function by using EXCEL Statistical Functions
3. determine the hypothetical price for which the demand might be zero
4. determine the size of the demand in the hypothetical case that the gasoline would be free (price = zero dollars!!!)
5. analyze the relevance and validity of a linear demand curve taking into consideration the #3 and #4 results.
Homework Answers
| Price | Number of gallons |
| $2.09 | 2143 |
| $2.19 | 2081 |
| $2.29 | 2097 |
| $2.39 | 2006 |
| $2.49 | 2011 |
| $2.59 | 1987 |
| $2.69 | 1937 |
| $2.78 | 1901 |
| $2.89 | 1915 |
| $2.99 | 1924 |
| $3.09 | 1870 |
| $3.19 | 1822 |
| $3.29 | 1767 |
| $3.39 | 1725 |
| $3.49 | 1693 |
| $3.59 | 1681 |
graphically by using EXCEL Graphics

the linear demand function is written on the above graphics
the hypothetical price for which the demand might be zero and the size of the demand in the hypothetical case that the gasoline would be free (price = zero dollars!!!)
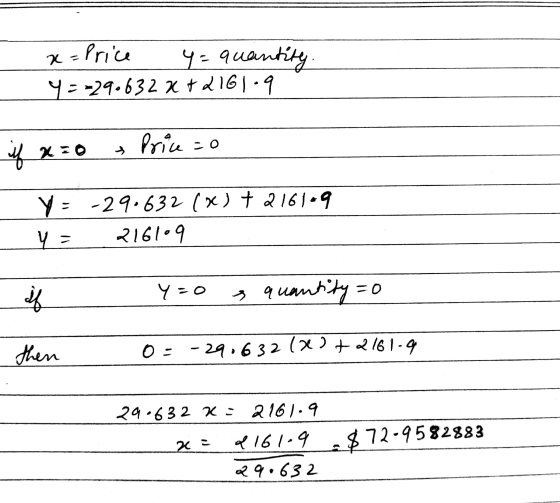
the relevance and validity of a linear demand curve taking into consideration the #3 and #4 results.

Add Answer to:
The manager of a gas station decided to identify his customers'
demand curve for gasoline of...
12.6. The manager of the Excom Service Station wants to foreca the demand for unleaded gasoline...
 12.6. The manager of the Excom Service Station wants to foreca the demand for unleaded gasoline next month so that the proper mem- ber of gallons can be ordered from the distributor The ner has cumulated the following data on demand for unleaded gasoline from sales during the past 10 months: MONTH GASOLINE DEMANDED (GALI 800 645 October November December January February March April May June July Comp ted ex linear and a accur 129. COM to for 730 810...
 12.6. The manager of the Excom Service Station wants to foreca the demand for unleaded gasoline next month so that the proper mem- ber of gallons can be ordered from the distributor The ner has cumulated the following data on demand for unleaded gasoline from sales during the past 10 months: MONTH GASOLINE DEMANDED (GALI 800 645 October November December January February March April May June July Comp ted ex linear and a accur 129. COM to for 730 810...
Most questions answered within 3 hours.
-
Where is the error in this code sequence?
String s1 = "Hello";
String s2 = "ello";...
asked 11 months ago -
Financial data for Joel de Paris, Inc., for last year
follow:
Joel de Paris, Inc.
Balance...
asked 11 months ago -
Consider this reaction:
Al2(SO4)3 (aq)+ BaCl3
(aq) Al2Cl6 (aq)- +
3BaSO4(s) . What is the...
asked 11 months ago -
Suppose that Savneet is considering increasing her
recent random sample from 20 car rentals to 40...
asked 11 months ago -
Trucks arrive at an unloading terminal at an average rate of 120
per hour.
Trucks arrive...
asked 11 months ago -
Why are methanol and ethanol completely soluble in water while
octanol is not very little soluble....
asked 11 months ago -
A facilities manager at a university reads in a research report
that the mean amount of...
asked 11 months ago -
When the CuSO4 is rehydrated by adding water to the anhydrous
compound, is this an endothermic...
asked 11 months ago -
A ray of sunlight is passing from diamond into crown glass; the
angle of incidence is...
asked 11 months ago -
A block of mass 0.249 kg is placed on top of a light, vertical
spring of...
asked 11 months ago -
how do the kidneys compensate in the presences of acidosis
a) trigger hyperventilate
b) reserve acid...
asked 11 months ago -
Question 501 pts
The rental rate of capital to the firm increases. Which of the
following...
asked 11 months ago