
|
Calculate the price per share of common equity as of 12/31/2018. |
|||||
|
|
|
|
|
|
|
|
Millions except price per share |
Actual |
|
|
|
|
|
|
2018/12/31 |
|
|
|
|
|
Value of operations (V0) |
|
|
|
|
|
|
+ Value of short-term investments |
|
|
|
|
|
|
Total value of company |
|
|
|
|
|
|
− Total value of all debt |
|
|
|
|
|
|
− Value of preferred stock |
|
|
|
|
|
|
Value of common equity |
|
|
|
|
|
|
Number of shares outstanding |
|
|
|
|
|
|
Price per share |
|
|
|
|
|
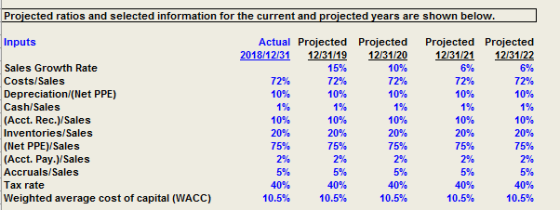
Projected ratios and selected information for the current and projected years are shown below. Inputs Actual Projected Projected 2018/12/31 Projected Projected 12/31/21 12/31/19 12/31/20 12/31/22 Sales Growth Rate 15% 10% 6% 6% Costs/Sales 72% 72% 72% 72% 72% Depreciation/(Net PPE) 10% 10% 10% 10% 10% Cash/Sales 1% 1% 1% 1% 1% (Acct. Rec.)/Sales 10% 10% 10% 10% 10% Inventories/Sales 20% 20% 20% 20% 20% (Net PPE)/Sales (Acct. Pay.)/Sales 75% 75% 75% 75% 75% 2% 2% 2% 2% 2% Accruals/Sales 5% 5% 5% 5% 5% Tax rate 40% 40% 40% 40% 40% |Weighted average cost of capital (WACC) 10.5% 10.5% 10.5% 10.5% 10.5%
Homework Answers
Price per share = $ 99.46
Please see the table below. Please be guided by the second column titled “Linkage” to understand the mathematics. You can also understand the mathematics making use of [+] / [-] sign appearing in the first column. The last row highlighted in yellow is your answer. Figures in parenthesis, if any, mean negative values. All financials are in $ mn except number of shares which is in mn and Price per share which is $ / shares.
| Parameter | Linkage | Actual | Projected | Projected | Projected | Projected |
| Year | 12/31/2018 | 12/31/2019 | 12/31/2020 | 12/31/2021 | 12/31/2022 | |
| Year number, n | 1 | 2 | 3 | 4 | ||
| y-o-y growth in sales | gi | 15% | 10% | 6% | 6% | |
| Net Sales | A = Ai-1 x (1 + gi) | 800 | 920.00 | 1,012.00 | 1,072.72 | 1,137.08 |
| Costs | B = 72% x A | 662.40 | 728.64 | 772.36 | 818.70 | |
| Depreciation | C = 10% x I (below) | 69.00 | 75.90 | 80.45 | 85.28 | |
| Cash | D = 1% x A | 8.00 | 9.20 | 10.12 | 10.73 | 11.37 |
| Acc. Receivables | E = 10% x A | 80.00 | 92.00 | 101.20 | 107.27 | 113.71 |
| Inventory | F = 20% x A | 160.00 | 184.00 | 202.40 | 214.54 | 227.42 |
| Accounts Payable | G = 2% x A | 16.00 | 18.40 | 20.24 | 21.45 | 22.74 |
| Accruals | H = 5% x A | 40.00 | 46.00 | 50.60 | 53.64 | 56.85 |
| Net PPE | I = 75% x A | 600.00 | 690.00 | 759.00 | 804.54 | 852.81 |
| Working capital | J = (D + E + F) - (G + H) | 192.00 | 220.80 | 242.88 | 257.45 | 272.90 |
| Increase in working capital | K = Ji+1 - Ji | 28.80 | 22.08 | 14.57 | 15.45 | |
| Capital Expenditure | L = Ii + C - Ii-1 | 159.00 | 144.90 | 125.99 | 133.55 | |
| EBIT x (1 - Tax rate) | M = (A - B - C) x (1 - 40%) | 113.16 | 124.48 | 131.94 | 139.86 | |
| [+] Depreciation | C | 69.00 | 75.90 | 80.45 | 85.28 | |
| [-] Increase in working capital | K | 28.80 | 22.08 | 14.57 | 15.45 | |
| [-] Capital expenditure | L | 159.00 | 144.90 | 125.99 | 133.55 | |
| FCFF | N = M + C - K - L | (5.64) | 33.40 | 71.83 | 76.14 | |
| WACC | R | 10.5% | ||||
| Terminal growth rate | g | 6% | ||||
| Horizon value | O = N2022 x (1 + g) / (R - g) | 1,793.56 | ||||
| PV factor | PVF = (1 + R)-n | 0.90498 | 0.81898 | 0.74116 | 0.67073 | |
| PV of FCFF | PV = PVF x FCFF | (5.10) | 27.35 | 53.24 | 51.07 | |
| [+] PV of Horizon value | PVHV = O x PVF2022 | 1,203.00 | ||||
| Value of operations (V0) | V0 = PV + PVHV | 1,329.56 | ||||
| [+] Value of short-term investments | P | 20.00 | ||||
| Total value of company | Q = V0 + P | 1,349.56 | ||||
| [-] Total value of all debt | R (= Notes payables + long term bonds) | 340.00 | ||||
| [-] Value of preferred stock | S | 15.00 | ||||
| Value of common equity | T = Q - R - S | 994.56 | ||||
| Number of shares outstanding (mn) | U | 10.00 | ||||
| Price per share ($ / share) | V = T / U | 99.46 |
Add Answer to:
Calculate the price per share of common equity as of
12/31/2018.
Millions except price per share...
a. Forecast the parts of the income statement and balance sheets necessary to calculate free cash...
 a. Forecast the parts of the income statement and
balance sheets necessary to calculate free cash flow.
Partial Income Statement for the Year Ending December 31
(Millions of Dollars)
Actual
Projected
Projected
Income Statement Items
2018/12/31
12/31/19
12/31/20
Net Sales
$800.0
Costs (except depreciation)
$576.0
Depreciation
$60.0
Total operating costs
$636.0
Earning before int. & tax
$164.0
Partial Balance Sheets for December 31 (Millions of
Dollars)
Actual
Projected
Projected
Operating Assets
2018/12/31
12/31/19
12/31/20
Cash
$8.0
Accounts receivable
$80.0
Inventories...
a. Forecast the parts of the income statement and
balance sheets necessary to calculate free cash flow.
Partial Income Statement for the Year Ending December 31
(Millions of Dollars)
Actual
Projected
Projected
Income Statement Items
2018/12/31
12/31/19
12/31/20
Net Sales
$800.0
Costs (except depreciation)
$576.0
Depreciation
$60.0
Total operating costs
$636.0
Earning before int. & tax
$164.0
Partial Balance Sheets for December 31 (Millions of
Dollars)
Actual
Projected
Projected
Operating Assets
2018/12/31
12/31/19
12/31/20
Cash
$8.0
Accounts receivable
$80.0
Inventories...
130 260 210 Davidson Corporation: Balance Sheet as of December 31, 2018 (Millions of Dollars) Assets...
 130 260 210 Davidson Corporation: Balance Sheet as of December 31, 2018 (Millions of Dollars) Assets Liabilities and Equity Cash and equivalents $ 15 Accounts payable Accounts receivable 555 Accruals Inventories 850 Notes payable Total current assets $ 1,420 Total current liabilities Net plant and equipment 2,540 Long-term bonds Total liabilities Common stock (100 million shares) Retained earnings Common equity Total assets $ 3,960 Total liabilities and equity $ 600 1,520 $ 2,120 240 $ 1,600 $ 1,840 $ 3,960...
Powell Panther Corporation: Income Statements for Year Ending December 31 (Millions of Dollars) 2018 2017 Sales...
 Powell Panther Corporation: Income Statements for Year Ending December 31 (Millions of Dollars) 2018 2017 Sales $2,310.0 $2,100.0 Operating costs excluding depreciation and amortization 1785.0 1,733.0 $ 577.0 $ 315.0 EBITDA Depreciation and amortization 53.0 46.0 $ 269.0 Earnings before interest and taxes (EBIT) 524.0 Interest 51.0 46.0 Earnings before taxes (EBT) 473.0 223.0 Taxes (40%) 189.2 89.2. Net income $ 283.8 $ 133.8 Common dividends $255.0 $107.0 Powell Panther Corporation: Balance Sheets as of December 31 (Millions of Dollars)...
Glocal Inc.: December 31: Balance Sheets (Millions of Dollars) Assets 2015 2016 iabilities and Equity Cash...
 Glocal Inc.: December 31: Balance Sheets (Millions of Dollars) Assets 2015 2016 iabilities and Equity Cash and equivalents 2016 2015 290 300 Accounts Payable Notes Payable Accruals Short-term investments 170 50 60 50 Accounts Receivable Inventories 190 140 300 400 130 200 350 300 Current Liabilities Total Current Assets 490 390 1,000 1,050 Long-Term Bonds 600 400 Total Liabilities Preferred stock 1,090 790 Net Plant and Equipment 30 40 1,000 550 Common Stock 200 170 Retained Earnings Total Common Equity...
Baresse Corporation: Income Statements for Year Ending December 31 (Millions of Dollars) 2019 2018 Sales $11,000...
Baresse Corporation: Income Statements for Year Ending December 31 (Millions of Dollars) 2019 2018 Sales $11,000 $10,000 Operating costs excluding depreciation 9,360 8,500 Depreciation and amortization 380 360 Earnings before interest and taxes $1,260 $1,140 Less interest 120 100 Pre-tax income $1,140 $1,040 Taxes (40%) $456 $416 Net income available to common shareholders $684 $624 Common dividends $220 $200 Baresse Corporation: Balance Sheets as of December 31 (Millions of Dollars) 2019 2018 Assets Cash $550 $500 Short term investments 110...
what is the debt to campital ratio? and ROIC and dividends per share Balance Sheet (Millions...
 what is the debt to campital ratio?
and
ROIC
and dividends per share
Balance Sheet (Millions of S) Assets Cash and securities Accounts receivable Inventories Total current assets Net plant and equipment Total assets Liabilities and Equity Accounts payable Accruals Notes payable Total current liabilities 2019 $4,200 17,500 20,300 $42.000 $28.000 $70,000 $22,509 14,391 6,000 $42.900 Long-term bonds Total liabilities Common stock Retained earnings Total common equity Total liabilities and equity $11,000 $53,900 $3,542 12,558 $16,100 $70,000 Income Statement (Millions...
what is the debt to campital ratio?
and
ROIC
and dividends per share
Balance Sheet (Millions of S) Assets Cash and securities Accounts receivable Inventories Total current assets Net plant and equipment Total assets Liabilities and Equity Accounts payable Accruals Notes payable Total current liabilities 2019 $4,200 17,500 20,300 $42.000 $28.000 $70,000 $22,509 14,391 6,000 $42.900 Long-term bonds Total liabilities Common stock Retained earnings Total common equity Total liabilities and equity $11,000 $53,900 $3,542 12,558 $16,100 $70,000 Income Statement (Millions...
Requirement 1h. Compute the earnings per share of common stock for 2018 and 2017. Begin by...
Requirement 1h. Compute the earnings per share of common stock for 2018 and 2017. Begin by selecting the formula to compute the earnings per share of common stock. Earnings per share = (Net income - Preferred dividends) / Weighted average number of common shares outstanding Now, compute the earnings per share for 2018 and 2017. (Round your answers to the nearest cent, $X.XX.) 2018: 2017: Banfield, Inc. Comparative Balance Sheet December 31, 2018 and 2017 2018 2017 2016* Assets Current...
THE HOME DEPOT, INC. CONSOLIDATED BALANCE SHEETS February 3, 2019 January 28, 2018 in millions, except per share data A...
 THE HOME DEPOT, INC. CONSOLIDATED BALANCE SHEETS February 3, 2019 January 28, 2018 in millions, except per share data Assets Current assets: Cash and cash equivalents 1,778 $ 3,595 Receivables, net 1,936 1,952 Merchandise inventories 13,925 12,748 Other current assets 890 638 Total current assets 18,529 18,933 22,375 Net property and equipment 22,075 Goodwill 2,252 2,275 Other assets 847 1,246 Total assets 44,003 44,529 Liabilities and Stockholders' Equity Current liabilities: 1,339 $ Short-term debt $ 1,559 Accounts payable Accrued salaries...
Lowe's Companies, Inc. Consolidated Statements of Earnings (In millions, except per share and percentage data) February...
 Lowe's Companies, Inc. Consolidated Statements of Earnings (In millions, except per share and percentage data) February 1, 0 Sales February 2, 20197 Sales 2018 $ 71,309 100.00% $ 68,619 48,40167.88 46,185 22,908 32.12 22,434 0% Sales February % Sales 100.00% $ 65,017 67.31 43,343 32.69 21,674 % Sales 100.00% 66.66 33.34 Fiscal years ended on Net sales Cost of sales Gross margin Expenses: Selling, general and administrative Depreciation and amortization Operating income Interest - net Loss on extinguishment of debt...
In Millions of BHD except Per Share 12 Months Ending 2014Y 31/12/2014 31/12/2015 31/12/2016 31/12/2017 30/09/2018...
 In Millions of BHD except Per Share 12 Months Ending 2014Y 31/12/2014 31/12/2015 31/12/2016 31/12/2017 30/09/2018 1,663.000 1,663.000 1,663.000 1,663.000 1,663.000 1,663.000 1,663.000 1,663.000 1,663.000 1,663.000 2015 Y 2016Y 2017 Y Last 12M 2 ic Shares Outstandin 4 Diluted Weighted Avg Shares c Weighted Avg Shares1,663.000 1,663.000 1,663.000 1,663.000 1,663.000 6 Per Share Data Items 8 Revenue 9 EBITDA 10 Operating Income 11 Net Income to Common- Basic 12 Net Income before XO- Basic 13 Normalized Net Income Basic 14...
 a. Forecast the parts of the income statement and
balance sheets necessary to calculate free cash flow.
Partial Income Statement for the Year Ending December 31
(Millions of Dollars)
Actual
Projected
Projected
Income Statement Items
2018/12/31
12/31/19
12/31/20
Net Sales
$800.0
Costs (except depreciation)
$576.0
Depreciation
$60.0
Total operating costs
$636.0
Earning before int. & tax
$164.0
Partial Balance Sheets for December 31 (Millions of
Dollars)
Actual
Projected
Projected
Operating Assets
2018/12/31
12/31/19
12/31/20
Cash
$8.0
Accounts receivable
$80.0
Inventories...
a. Forecast the parts of the income statement and
balance sheets necessary to calculate free cash flow.
Partial Income Statement for the Year Ending December 31
(Millions of Dollars)
Actual
Projected
Projected
Income Statement Items
2018/12/31
12/31/19
12/31/20
Net Sales
$800.0
Costs (except depreciation)
$576.0
Depreciation
$60.0
Total operating costs
$636.0
Earning before int. & tax
$164.0
Partial Balance Sheets for December 31 (Millions of
Dollars)
Actual
Projected
Projected
Operating Assets
2018/12/31
12/31/19
12/31/20
Cash
$8.0
Accounts receivable
$80.0
Inventories...
 130 260 210 Davidson Corporation: Balance Sheet as of December 31, 2018 (Millions of Dollars) Assets Liabilities and Equity Cash and equivalents $ 15 Accounts payable Accounts receivable 555 Accruals Inventories 850 Notes payable Total current assets $ 1,420 Total current liabilities Net plant and equipment 2,540 Long-term bonds Total liabilities Common stock (100 million shares) Retained earnings Common equity Total assets $ 3,960 Total liabilities and equity $ 600 1,520 $ 2,120 240 $ 1,600 $ 1,840 $ 3,960...
 Powell Panther Corporation: Income Statements for Year Ending December 31 (Millions of Dollars) 2018 2017 Sales $2,310.0 $2,100.0 Operating costs excluding depreciation and amortization 1785.0 1,733.0 $ 577.0 $ 315.0 EBITDA Depreciation and amortization 53.0 46.0 $ 269.0 Earnings before interest and taxes (EBIT) 524.0 Interest 51.0 46.0 Earnings before taxes (EBT) 473.0 223.0 Taxes (40%) 189.2 89.2. Net income $ 283.8 $ 133.8 Common dividends $255.0 $107.0 Powell Panther Corporation: Balance Sheets as of December 31 (Millions of Dollars)...
 Glocal Inc.: December 31: Balance Sheets (Millions of Dollars) Assets 2015 2016 iabilities and Equity Cash and equivalents 2016 2015 290 300 Accounts Payable Notes Payable Accruals Short-term investments 170 50 60 50 Accounts Receivable Inventories 190 140 300 400 130 200 350 300 Current Liabilities Total Current Assets 490 390 1,000 1,050 Long-Term Bonds 600 400 Total Liabilities Preferred stock 1,090 790 Net Plant and Equipment 30 40 1,000 550 Common Stock 200 170 Retained Earnings Total Common Equity...
 what is the debt to campital ratio?
and
ROIC
and dividends per share
Balance Sheet (Millions of S) Assets Cash and securities Accounts receivable Inventories Total current assets Net plant and equipment Total assets Liabilities and Equity Accounts payable Accruals Notes payable Total current liabilities 2019 $4,200 17,500 20,300 $42.000 $28.000 $70,000 $22,509 14,391 6,000 $42.900 Long-term bonds Total liabilities Common stock Retained earnings Total common equity Total liabilities and equity $11,000 $53,900 $3,542 12,558 $16,100 $70,000 Income Statement (Millions...
what is the debt to campital ratio?
and
ROIC
and dividends per share
Balance Sheet (Millions of S) Assets Cash and securities Accounts receivable Inventories Total current assets Net plant and equipment Total assets Liabilities and Equity Accounts payable Accruals Notes payable Total current liabilities 2019 $4,200 17,500 20,300 $42.000 $28.000 $70,000 $22,509 14,391 6,000 $42.900 Long-term bonds Total liabilities Common stock Retained earnings Total common equity Total liabilities and equity $11,000 $53,900 $3,542 12,558 $16,100 $70,000 Income Statement (Millions...
 THE HOME DEPOT, INC. CONSOLIDATED BALANCE SHEETS February 3, 2019 January 28, 2018 in millions, except per share data Assets Current assets: Cash and cash equivalents 1,778 $ 3,595 Receivables, net 1,936 1,952 Merchandise inventories 13,925 12,748 Other current assets 890 638 Total current assets 18,529 18,933 22,375 Net property and equipment 22,075 Goodwill 2,252 2,275 Other assets 847 1,246 Total assets 44,003 44,529 Liabilities and Stockholders' Equity Current liabilities: 1,339 $ Short-term debt $ 1,559 Accounts payable Accrued salaries...
 Lowe's Companies, Inc. Consolidated Statements of Earnings (In millions, except per share and percentage data) February 1, 0 Sales February 2, 20197 Sales 2018 $ 71,309 100.00% $ 68,619 48,40167.88 46,185 22,908 32.12 22,434 0% Sales February % Sales 100.00% $ 65,017 67.31 43,343 32.69 21,674 % Sales 100.00% 66.66 33.34 Fiscal years ended on Net sales Cost of sales Gross margin Expenses: Selling, general and administrative Depreciation and amortization Operating income Interest - net Loss on extinguishment of debt...
 In Millions of BHD except Per Share 12 Months Ending 2014Y 31/12/2014 31/12/2015 31/12/2016 31/12/2017 30/09/2018 1,663.000 1,663.000 1,663.000 1,663.000 1,663.000 1,663.000 1,663.000 1,663.000 1,663.000 1,663.000 2015 Y 2016Y 2017 Y Last 12M 2 ic Shares Outstandin 4 Diluted Weighted Avg Shares c Weighted Avg Shares1,663.000 1,663.000 1,663.000 1,663.000 1,663.000 6 Per Share Data Items 8 Revenue 9 EBITDA 10 Operating Income 11 Net Income to Common- Basic 12 Net Income before XO- Basic 13 Normalized Net Income Basic 14...
Most questions answered within 3 hours.
-
Where is the error in this code sequence?
String s1 = "Hello";
String s2 = "ello";...
asked 11 months ago -
Financial data for Joel de Paris, Inc., for last year
follow:
Joel de Paris, Inc.
Balance...
asked 11 months ago -
Consider this reaction:
Al2(SO4)3 (aq)+ BaCl3
(aq) Al2Cl6 (aq)- +
3BaSO4(s) . What is the...
asked 11 months ago -
Suppose that Savneet is considering increasing her
recent random sample from 20 car rentals to 40...
asked 11 months ago -
Trucks arrive at an unloading terminal at an average rate of 120
per hour.
Trucks arrive...
asked 11 months ago -
Why are methanol and ethanol completely soluble in water while
octanol is not very little soluble....
asked 11 months ago -
A facilities manager at a university reads in a research report
that the mean amount of...
asked 11 months ago -
When the CuSO4 is rehydrated by adding water to the anhydrous
compound, is this an endothermic...
asked 11 months ago -
A ray of sunlight is passing from diamond into crown glass; the
angle of incidence is...
asked 11 months ago -
A block of mass 0.249 kg is placed on top of a light, vertical
spring of...
asked 11 months ago -
how do the kidneys compensate in the presences of acidosis
a) trigger hyperventilate
b) reserve acid...
asked 11 months ago -
Question 501 pts
The rental rate of capital to the firm increases. Which of the
following...
asked 11 months ago