


1 points IlowskyintroStatt B.PR 020 My Notes O Ask Your Teachen A sample of 20 heads of lettuce was selected. Assume that the population distribution of head weight is normal. The weight of each head of lettuce was then recorded. The mean weight was 2.2 pounds with a standard deviation of 0.1 pounds. The population standard deviation is known to be 0.2 pounds In complete sentences, give an interpretation of what the 95 % confidence interval for the population mean weight of the heads of lettuce means. We are 95% confident that the weight of a head of lettuce lies within this interval O There is a 95 % chance that the weight of a head of lettuce lies within this interval. We are 95 % confident that the mean weight of the sample of 20 heads of lettuce lies within this interval We are 95 % confident that the true population mean weight of all weights of heads of lettuce lies within this interval. O Ask Your Teache O1 points IlowskylntroStat1 8.PR.022 My Note A sample of 20 heads of lettuce was selected. Assume that the population distribution of head weight is normal. The weight of each head of lettuce was then recorded. The mean weight was 2.2 pounds with a standard deviation of 0.1 pounds. The population standard deviation is known to be 0.2 pounds. What would happen if 40 heads of lettuce were sampled instead of 20, and the confidence level remained the same? O The confidence interval would become wider. There would be no change. The confidence interval would become narrower.
O-14 points lowskylntroStatt 8.PR 038 7 My Notes Ask Your Teacher + A hospital is trying to cut down on emergency room wait times. It is interested in the amount of time patients must wait before being called back to be examined. An investigation committee randomly surveyed 70 patients. The sample mean was 1.5 hours with a sample standard deviation of 0.5 hours. Identify the following. (Enter exact numbers as integers, fractions, or decimals.) (a) x (b) (c) n (d) n-1 8 1 points llowskylntroStat1 8 PR 040 Ask Your Taachas My Notes A hospital is trying to cut down on emergency room wait times. It is interested in the amount of time patients must wait before being called back to be examined. An investigation committee randomly surveyed 70 patients. The sample mean was 1.5 hours with a sample standard deviation of 0.5 hours. Which distribution should you use for this problem? (Enter your answer in the form z or tar where df is the degrees of freedom.)
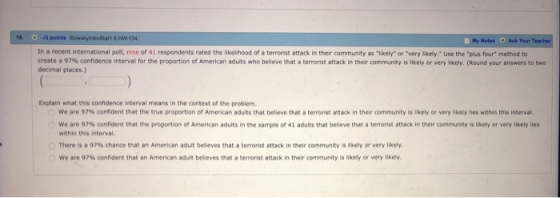
18. 13 points lowskylntroStat1 8HW.134. O Ask Your Teacher My Notes In a recent international poll, nine of 41 respondents rated the likelihood of a terrorist attack in their community as "likely" or "very likely. Use the "plus four" method to create a 97% confidence interval for the proportion of American adults who believe that a terrorist attack in their community is likely or very likely. (Round your answers to two decimal places.) Explain what this confidence interval means in the context of the problem We are 97 % confident that the true proportion of American adults that believe that a terrorist attack in their community is likely or very likely lies within this interval. We are 97 % confident that the proportion of American adults in the sample of 41 adults that believe that a terrorist attack in their community is likely or very likely lies within this interval. There is a 97 % chance that an American adult believes that a terrorist attack in their community is likely or very likely We are 97 % confident that an American adult believes that a terrorist attack in their community is likely or very likely
Homework Answers
 Dear
student HomeworkLib policy allowed only one solution at time . Please
repost others . Thank you!
Dear
student HomeworkLib policy allowed only one solution at time . Please
repost others . Thank you!
Add Answer to:
O-7 points BowskyintroStatt 8PR.018. My Notes Ask Your Teacher A sample of 20 heads of lettuce...
A sample of 20 heads of lettuce was selected. Assume that the population distribution of head...
A sample of 20 heads of lettuce was selected. Assume that the population distribution of head weight is normal. The weight of each head of lettuce was then recorded. The mean weight was 2.2 pounds with a standard deviation of 0.1 pounds. The population standard deviation is known to be 0.2 pounds. Construct a 95% confidence interval for the population mean weight of the heads of lettuce. State the confidence interval. Sketch the graph. Calculate the error bound.
(6) A sample of 20 heads of lettuce was selected. Assume that the population distribution of...
 (6) A sample of 20 heads of lettuce was selected. Assume that the population distribution of head weight is normal. The weight of each head of lettuce was then recorded. The mean weight was 2.2 pounds with a standard deviation of 0.1 pounds. The population standard deviation is known to be 0.2 pounds. Find a 90% confidence interval estimate for the population mean weight of the heads of lettuce. (10 points] (7) EC In a recent study reported Oct. 29,...
1. 0.5/2.5 points| Provious Answers DavoreStat9 7.E.012 My Notes Ask Your Teacher The following observations are...
 1. 0.5/2.5 points| Provious Answers DavoreStat9 7.E.012 My Notes Ask Your Teacher The following observations are lifetimes (days) subsequent to diagnosis for individuals suffering from blood cancer 116 865 182 925 256 984 1025 1062 1063 1165 1191 1222 1222 1251 419 442 461 516 739744 789 B08 1278 1291 135B 1369 1408 1456 1478 1519 1578 1578 1599 16041606 1697 1736 1799 1815 1853 1899 1925 1966 (a) Can a confidence interval for true average lifetime be calculated without...
1. - 1.25 points StatsByL01 15.2A.004. My Notes Ask Your Teacher A student conducts a simple...
 1. - 1.25 points StatsByL01 15.2A.004. My Notes Ask Your Teacher A student conducts a simple random sample of students from her high school and finds that 22 out of 110 students in her sample regularly walk to school. Give a point estimate for the proportion of all Students at her high school who regularly walk to school Submit Answer 2. -/1.25 points UHStat4 10.E.044. My Notes Ask Your Teacher For each combination of sample size and sample proportion, find...
+ 0.84/4.16 points Previous Answers ASWSBE14 8.E.003. My Notes + Ask Your Teacher You may need...
 + 0.84/4.16 points Previous Answers ASWSBE14 8.E.003. My Notes + Ask Your Teacher You may need to use the appropriate appendix table or technology to answer this question. A simple random sample of 90 items resulted in a sample mean of 60. The population standard deviation is o = 10. (a) Compute the 95% confidence interval for the population mean. (Round your answers to two decimal places.) to (b) Assume that the same sample mean was obtained from a sample...
11. 4 points DevoreStat9 7.E.023. My Notes A certain forum reported that in a survey of...
 11. 4 points DevoreStat9 7.E.023. My Notes A certain forum reported that in a survey of 2008 American adults, 27% said they believed in astrology. (a) Calculate a confidence interval at the 99% confidence level for the proportion of all adult Americans who believe in astrology. (Round your answers to three decimal places.) Interpret the resulting interval. we are 99% confident that this interval does not contain the true population mean. 0 we are 99% confident that the true population...
13. [-/7 Points] DETAILS PECKSTAT2 9.R.090. MY NOTES ASK YOUR TEACHER An article summarized results from...
 13. [-/7 Points] DETAILS PECKSTAT2 9.R.090. MY NOTES ASK YOUR TEACHER An article summarized results from a national survey of 2,102 Americans age 8 to 18. The sample was selected to be representative of Americans in this age group. (Use a table or technology.) (a) of those surveyed, 1,226 reported owning a cell phone. Use this information to construct a 90% confidence interval estimate of the proportion of all Americans age 8 to 18 who own a cell phone. (Round...
The sample mean weights for two varieties of lettuce grown for 16 days in a controlled...
The sample mean weights for two varieties of lettuce grown for 16 days in a controlled environment are 3.259 and 1.413 and the corresponding sample standard deviations are .400 and .220. If the sample sizes for the two varieties are 9 and 6 respectively, obtain a 95% confidence interval for the difference of the mean weights assuming that the two population standard deviations are equal. (Given: weight of each variety of lettuce is normally distributed)
-/1 POINTS MENDSTAT15 8.4.001. MY NOTES ASK YOUR TEACHER Independent random samples were selected from two...
 -/1 POINTS MENDSTAT15 8.4.001. MY NOTES ASK YOUR TEACHER Independent random samples were selected from two quantitative populations, with sample sizes, means, and variances given below. Sample Size Sample Mean Sample Variance Population 2 38 43 9.4 7.3 8.32 14.72 Construct a 90% confidence interval for the difference in the population means. (Use u, - \2. Round your answers to two decimal places.) to Construct a 99% confidence interval for the difference in the population means. (Round your answers to...
+0/4.25 points | Previous Answers DevoreStat9 7.E.035 My Notes Ask Your Teacher Silicone implant ...
 +0/4.25 points | Previous Answers DevoreStat9 7.E.035 My Notes Ask Your Teacher Silicone implant augmentation rhinoplasty is used to correct congenital nose deformities. The success of the procedure depends on various biomechanical properties of the human nasal periosteum and fascia. An article reported that for a sample of 14 (newly deceased) adults, the mean failure strainwas 25.0, and the standard deviation was 3.4 (a) Assuming a normal distribution for failure strain, estimate true average strain in a way that conveys...
 (6) A sample of 20 heads of lettuce was selected. Assume that the population distribution of head weight is normal. The weight of each head of lettuce was then recorded. The mean weight was 2.2 pounds with a standard deviation of 0.1 pounds. The population standard deviation is known to be 0.2 pounds. Find a 90% confidence interval estimate for the population mean weight of the heads of lettuce. (10 points] (7) EC In a recent study reported Oct. 29,...
 1. 0.5/2.5 points| Provious Answers DavoreStat9 7.E.012 My Notes Ask Your Teacher The following observations are lifetimes (days) subsequent to diagnosis for individuals suffering from blood cancer 116 865 182 925 256 984 1025 1062 1063 1165 1191 1222 1222 1251 419 442 461 516 739744 789 B08 1278 1291 135B 1369 1408 1456 1478 1519 1578 1578 1599 16041606 1697 1736 1799 1815 1853 1899 1925 1966 (a) Can a confidence interval for true average lifetime be calculated without...
 1. - 1.25 points StatsByL01 15.2A.004. My Notes Ask Your Teacher A student conducts a simple random sample of students from her high school and finds that 22 out of 110 students in her sample regularly walk to school. Give a point estimate for the proportion of all Students at her high school who regularly walk to school Submit Answer 2. -/1.25 points UHStat4 10.E.044. My Notes Ask Your Teacher For each combination of sample size and sample proportion, find...
 + 0.84/4.16 points Previous Answers ASWSBE14 8.E.003. My Notes + Ask Your Teacher You may need to use the appropriate appendix table or technology to answer this question. A simple random sample of 90 items resulted in a sample mean of 60. The population standard deviation is o = 10. (a) Compute the 95% confidence interval for the population mean. (Round your answers to two decimal places.) to (b) Assume that the same sample mean was obtained from a sample...
 11. 4 points DevoreStat9 7.E.023. My Notes A certain forum reported that in a survey of 2008 American adults, 27% said they believed in astrology. (a) Calculate a confidence interval at the 99% confidence level for the proportion of all adult Americans who believe in astrology. (Round your answers to three decimal places.) Interpret the resulting interval. we are 99% confident that this interval does not contain the true population mean. 0 we are 99% confident that the true population...
 13. [-/7 Points] DETAILS PECKSTAT2 9.R.090. MY NOTES ASK YOUR TEACHER An article summarized results from a national survey of 2,102 Americans age 8 to 18. The sample was selected to be representative of Americans in this age group. (Use a table or technology.) (a) of those surveyed, 1,226 reported owning a cell phone. Use this information to construct a 90% confidence interval estimate of the proportion of all Americans age 8 to 18 who own a cell phone. (Round...
 -/1 POINTS MENDSTAT15 8.4.001. MY NOTES ASK YOUR TEACHER Independent random samples were selected from two quantitative populations, with sample sizes, means, and variances given below. Sample Size Sample Mean Sample Variance Population 2 38 43 9.4 7.3 8.32 14.72 Construct a 90% confidence interval for the difference in the population means. (Use u, - \2. Round your answers to two decimal places.) to Construct a 99% confidence interval for the difference in the population means. (Round your answers to...
 +0/4.25 points | Previous Answers DevoreStat9 7.E.035 My Notes Ask Your Teacher Silicone implant augmentation rhinoplasty is used to correct congenital nose deformities. The success of the procedure depends on various biomechanical properties of the human nasal periosteum and fascia. An article reported that for a sample of 14 (newly deceased) adults, the mean failure strainwas 25.0, and the standard deviation was 3.4 (a) Assuming a normal distribution for failure strain, estimate true average strain in a way that conveys...
Most questions answered within 3 hours.
-
Where is the error in this code sequence?
String s1 = "Hello";
String s2 = "ello";...
asked 10 months ago -
Financial data for Joel de Paris, Inc., for last year
follow:
Joel de Paris, Inc.
Balance...
asked 10 months ago -
Consider this reaction:
Al2(SO4)3 (aq)+ BaCl3
(aq) Al2Cl6 (aq)- +
3BaSO4(s) . What is the...
asked 10 months ago -
Suppose that Savneet is considering increasing her
recent random sample from 20 car rentals to 40...
asked 10 months ago -
Trucks arrive at an unloading terminal at an average rate of 120
per hour.
Trucks arrive...
asked 10 months ago -
Why are methanol and ethanol completely soluble in water while
octanol is not very little soluble....
asked 10 months ago -
A facilities manager at a university reads in a research report
that the mean amount of...
asked 10 months ago -
When the CuSO4 is rehydrated by adding water to the anhydrous
compound, is this an endothermic...
asked 10 months ago -
A ray of sunlight is passing from diamond into crown glass; the
angle of incidence is...
asked 10 months ago -
A block of mass 0.249 kg is placed on top of a light, vertical
spring of...
asked 10 months ago -
how do the kidneys compensate in the presences of acidosis
a) trigger hyperventilate
b) reserve acid...
asked 10 months ago -
Question 501 pts
The rental rate of capital to the firm increases. Which of the
following...
asked 10 months ago