Section II – Suppose we gathered the data below by an unbiased method. (The data is sorted DOWN the columns.)
Use the data to create a histogram using six (6) classes. First class should start at 111.
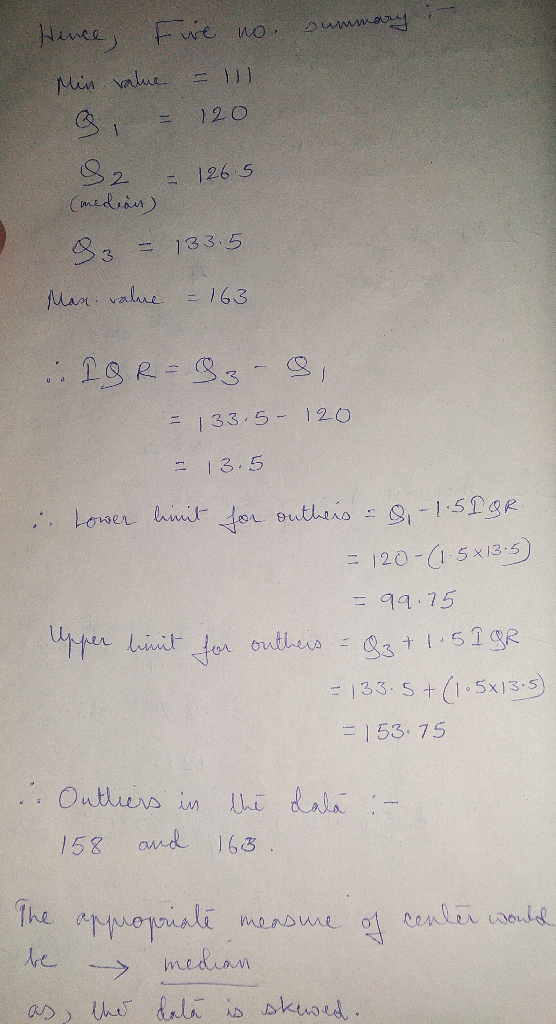
Give the Five-number summary of the data.
Describe the data set. Be specific and note any gaps and/or outliers. Use the 1.5-IQR test to locate outliers.
What description of center would be appropriate for the data set? Explain why?
Draw a box plot.
Homework Answers


Add Answer to:
Section II – Suppose we gathered the data below by an unbiased
method. (The data is...
How do I plot a series graph with this data provided? Month 1987 1988 1989 1990...
How do I plot a series graph with this data provided? Month 1987 1988 1989 1990 1991 1992 1993 1994 1995 1996 Jan 95 104 101 88 132 125 111 127 119 147 Feb 94 100 96 110 109 118 123 129 147 146 Mar 98 99 82 129 101 121 121 132 164 133 Apr 96 88 84 113 111 140 139 108 135 148 May 95 89 85 114 140 141 119 115 124 141 Jun 115 108...
4.15 construct a box plot for the data in exercise 4.1 down, then across Table 4B...
 4.15 construct a box plot for the data in exercise
4.1
down, then across Table 4B Electronic Component Failure Time 127 125 131 124 123 120 121 136 140 118 131 125 56 Chapter 4 Statistical Inference about Product Table 4E. Continued 119 128 133 137 124 142 123 137 125 124 128 129 130 122 133 124 129 121 142 151 160 125 141 125 140 131 129 126
4.15 construct a box plot for the data in exercise
4.1
down, then across Table 4B Electronic Component Failure Time 127 125 131 124 123 120 121 136 140 118 131 125 56 Chapter 4 Statistical Inference about Product Table 4E. Continued 119 128 133 137 124 142 123 137 125 124 128 129 130 122 133 124 129 121 142 151 160 125 141 125 140 131 129 126
The data set represents the numbers of minutes a sample of 27 people distribution for the...
 The data set represents the numbers of minutes a sample of 27 people distribution for the data set using five classes. 1. exercise each week. Construct a frequency 108 139 120 123 120 132 123 131 131 157 150 124 111 101 135 119 116 117 127 128 139 119 118 114 127 142 130 Classes Class boundaries Frequency Midpoint Relative Cumulative frequeney frequency Relative Frequency Histogram Cumulative Frequency Graph or Ogive Relative Frequency Histogram Cumulative Frequency Graph or Ogive
Please do NOT use Minitab - show all calculations for creating the probability plot. Using Excel...
 Please do NOT use Minitab - show all calculations for creating
the probability plot. Using Excel is okay.
Reconsider Problem 3 in Homework 3. Is the set of measurements well described by a normal distribution? Show all the calculations. The measurements of a temperature sensor (in °F) are shown below. 124 118 131 125 133 123 120 119 128 133 127 125 131 124 129 121 142 151 160 125 121 136 140 137 125 124 128 129 130 141...
Please do NOT use Minitab - show all calculations for creating
the probability plot. Using Excel is okay.
Reconsider Problem 3 in Homework 3. Is the set of measurements well described by a normal distribution? Show all the calculations. The measurements of a temperature sensor (in °F) are shown below. 124 118 131 125 133 123 120 119 128 133 127 125 131 124 129 121 142 151 160 125 121 136 140 137 125 124 128 129 130 141...
The following data set consists the number of minutes a sample of 25 people run every...
The following data set consists the number of minutes a sample of 25 people run every week. 108 139 120 123 120 132 123 131 131 157 150 124 119 119 116 117 127 128 139 118 114 127 111 101 135 1. Make a frequency distribution of the data set using five classes. Include class limits, midpoints, frequencies, boundaries. 2. Display the data using a frequency histogram. 3.Approximate the sample mean, sample variance , and standard deviation.
Grambling State University Department of Mathematies and Physics Probability and Statisties 1,SPLING 2019 Exam I, 01/23/2019...
 Grambling State University Department of Mathematies and Physics Probability and Statisties 1,SPLING 2019 Exam I, 01/23/2019 Please show all the details I. The amount of protein(in grams) for a variety of some fast food reported here. 1. Construct a frequency distribution using 6 cl a histogram, a frequency polygon, and an ogive for the data. 123, 130, 120, 127, 144, 126, 135, 120, 129, 129, 125, 115, 118, 127, 119, 122, 112, 126, 134, 115, 127, 135, 126, 143, 135,...
(Use Excel) italy common for people to put on weight when they quit smoking While a...
 (Use Excel) italy common for people to put on weight when they quit smoking While a small weight gain is normal c e weight gain can create new health concerns that brode the benefits of not smoking. The accompanying table shows a portion of the weight data for 50 women before quitting and six months after quitting Use Table 2 Weight Before Quilling 140 144 138 Weight After Quilling 155 142 163 146 129 149 136 127 158 145 118...
a. Calculate the sample average. b. Calculate the sample standard deviation. 4. The time to failure...
 a. Calculate the sample average. b. Calculate the sample standard deviation. 4. The time to failure in hours of an electronic component subjected to an accelerated life test is shown in Table 3E.1. To accelerate the failure test, the units were tested at an elevated temperature (read down, then across). a. Calculate the sample average and standard deviation. b. Construct a histogram. c. Construct a stem-and-leaf plot. d. Find the sample median and the lower and upper quartiles. TABLE 3E.1...
SCENARIO You are a Marriage and Family Therapist. In your practice, you’ve noticed that children seem...
SCENARIO You are a Marriage and Family Therapist. In your practice, you’ve noticed that children seem to be dramatically influenced by their parent’s marital relationship. You think that changes in marital relationship can be predictive of a child’s overall life satisfaction. In order to test this, you collect data from both children and their parents (n=20). You give the children in your study the Child Psychological Wellbeing Inventory (CPWI) and their parents the Marital Satisfaction Survey (MSS). Using the data...
The measurements of a temperature sensor (in °F) are provided. Is the set of measurements well...
The measurements of a temperature sensor (in °F) are provided. Is the set of measurements well described by a normal distribution? Calculate the R^2 and R^2 adjusted values. Show all the calculations. Order Temperature (F) 1 118 2 119 3 120 4 121 5 121 6 122 7 123 8 123 9 124 10 124 11 124 12 124 13 125 14 125 15 125 16 125 17 125 18 126 19 127 20 128 21 128 22 129 23...
 4.15 construct a box plot for the data in exercise
4.1
down, then across Table 4B Electronic Component Failure Time 127 125 131 124 123 120 121 136 140 118 131 125 56 Chapter 4 Statistical Inference about Product Table 4E. Continued 119 128 133 137 124 142 123 137 125 124 128 129 130 122 133 124 129 121 142 151 160 125 141 125 140 131 129 126
4.15 construct a box plot for the data in exercise
4.1
down, then across Table 4B Electronic Component Failure Time 127 125 131 124 123 120 121 136 140 118 131 125 56 Chapter 4 Statistical Inference about Product Table 4E. Continued 119 128 133 137 124 142 123 137 125 124 128 129 130 122 133 124 129 121 142 151 160 125 141 125 140 131 129 126
 The data set represents the numbers of minutes a sample of 27 people distribution for the data set using five classes. 1. exercise each week. Construct a frequency 108 139 120 123 120 132 123 131 131 157 150 124 111 101 135 119 116 117 127 128 139 119 118 114 127 142 130 Classes Class boundaries Frequency Midpoint Relative Cumulative frequeney frequency Relative Frequency Histogram Cumulative Frequency Graph or Ogive Relative Frequency Histogram Cumulative Frequency Graph or Ogive
 Please do NOT use Minitab - show all calculations for creating
the probability plot. Using Excel is okay.
Reconsider Problem 3 in Homework 3. Is the set of measurements well described by a normal distribution? Show all the calculations. The measurements of a temperature sensor (in °F) are shown below. 124 118 131 125 133 123 120 119 128 133 127 125 131 124 129 121 142 151 160 125 121 136 140 137 125 124 128 129 130 141...
Please do NOT use Minitab - show all calculations for creating
the probability plot. Using Excel is okay.
Reconsider Problem 3 in Homework 3. Is the set of measurements well described by a normal distribution? Show all the calculations. The measurements of a temperature sensor (in °F) are shown below. 124 118 131 125 133 123 120 119 128 133 127 125 131 124 129 121 142 151 160 125 121 136 140 137 125 124 128 129 130 141...
 Grambling State University Department of Mathematies and Physics Probability and Statisties 1,SPLING 2019 Exam I, 01/23/2019 Please show all the details I. The amount of protein(in grams) for a variety of some fast food reported here. 1. Construct a frequency distribution using 6 cl a histogram, a frequency polygon, and an ogive for the data. 123, 130, 120, 127, 144, 126, 135, 120, 129, 129, 125, 115, 118, 127, 119, 122, 112, 126, 134, 115, 127, 135, 126, 143, 135,...
 (Use Excel) italy common for people to put on weight when they quit smoking While a small weight gain is normal c e weight gain can create new health concerns that brode the benefits of not smoking. The accompanying table shows a portion of the weight data for 50 women before quitting and six months after quitting Use Table 2 Weight Before Quilling 140 144 138 Weight After Quilling 155 142 163 146 129 149 136 127 158 145 118...
 a. Calculate the sample average. b. Calculate the sample standard deviation. 4. The time to failure in hours of an electronic component subjected to an accelerated life test is shown in Table 3E.1. To accelerate the failure test, the units were tested at an elevated temperature (read down, then across). a. Calculate the sample average and standard deviation. b. Construct a histogram. c. Construct a stem-and-leaf plot. d. Find the sample median and the lower and upper quartiles. TABLE 3E.1...
Most questions answered within 3 hours.
-
Where is the error in this code sequence?
String s1 = "Hello";
String s2 = "ello";...
asked 10 months ago -
Financial data for Joel de Paris, Inc., for last year
follow:
Joel de Paris, Inc.
Balance...
asked 10 months ago -
Consider this reaction:
Al2(SO4)3 (aq)+ BaCl3
(aq) Al2Cl6 (aq)- +
3BaSO4(s) . What is the...
asked 10 months ago -
Suppose that Savneet is considering increasing her
recent random sample from 20 car rentals to 40...
asked 10 months ago -
Trucks arrive at an unloading terminal at an average rate of 120
per hour.
Trucks arrive...
asked 10 months ago -
Why are methanol and ethanol completely soluble in water while
octanol is not very little soluble....
asked 10 months ago -
A facilities manager at a university reads in a research report
that the mean amount of...
asked 10 months ago -
When the CuSO4 is rehydrated by adding water to the anhydrous
compound, is this an endothermic...
asked 10 months ago -
A ray of sunlight is passing from diamond into crown glass; the
angle of incidence is...
asked 10 months ago -
A block of mass 0.249 kg is placed on top of a light, vertical
spring of...
asked 10 months ago -
how do the kidneys compensate in the presences of acidosis
a) trigger hyperventilate
b) reserve acid...
asked 10 months ago -
Question 501 pts
The rental rate of capital to the firm increases. Which of the
following...
asked 10 months ago