Forecast energy use for the four quarters of year 26, beginning with winter.
For winter of year 26, the forecast for the energy use is (round your response to two decimal places).
Forecast energy use for the each quarter of year 26 (round your responses to two decimal places):
Homework Answers
Answers are in BOLD
| Q | relative, r | Forecast using, Ft=80+ 0.43*Q | Forecast with relative index= Overall average*r | |
| year 26 Q1 | 101 | 0.8 | 123.43 | 98.74 |
| year 26 Q2 | 102 | 1.2 | 274.00 | 328.80 |
| year 26 Q3 | 103 | 1.4 | 276.00 | 386.40 |
| year 26 Q4 | 104 | 0.6 | 278.00 | 166.80 |
| Overall average | 237.86 |
Add Answer to:
Forecast energy use for the four quarters of year 26, beginning
with winter.
For winter of...
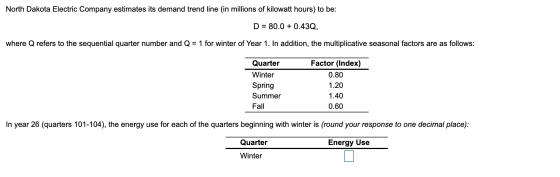
North Dakota Electric Company estimates its demand trend line (in millions of kilowatt hours) to be:...
North Dakota Electric Company estimates its demand trend line (in millions of kilowatt hours) to be: D = 80.0 + 0.50Q, where Q refers to the sequential quarter number and Q = 1 for winter of Year 1. In addition, the multiplicative seasonal factors are as follows: Quarter Factor (Index) Winter 0.75 Spring 1.25 Summer 1.45 Fall 0.55 In year 26 (quarters 101-104), the energy use for each of the quarters beginning with winter is (round your response to one...
The first quart forecast is _____ The second quarter forecast is _____ The third quarter forecast...
 The
first quart forecast is _____
The second quarter forecast is _____
The third quarter forecast is _____
The fourth quarter forecast is _____
The manager of a utility company in the Texas panhandle wants to develop quarterly forecasts of power loads for the next year. The power loads are seasonal, and the data on the quarterly loads in megawatts (MW) for the last four years are as follows: Year 1 Year 4 Year 2 98.1 Quarter Year 3 127.6...
The
first quart forecast is _____
The second quarter forecast is _____
The third quarter forecast is _____
The fourth quarter forecast is _____
The manager of a utility company in the Texas panhandle wants to develop quarterly forecasts of power loads for the next year. The power loads are seasonal, and the data on the quarterly loads in megawatts (MW) for the last four years are as follows: Year 1 Year 4 Year 2 98.1 Quarter Year 3 127.6...
Find the seasonalized forecast for Q2 of 2017.The sales trend has been modeled as: Sales =...
Find the seasonalized forecast for Q2 of 2017.The sales trend has been modeled as: Sales = 255.00+ 2 * t , where t= time in quarters, beginning in Q1 2014. Seasonality for the four quarterly periods is given in the table below. QUARTER SEASONAL FACTOR Q #1 1.2 Q #2 1.18 Q #3 0.5 Q #4 ** Round to 1 Decimal Place! **
The manager of a utility company in the Texas panhandle wants to develop quarterly forecasts of...
The manager of a utility company in the Texas panhandle wants to develop quarterly forecasts of power loads for the next year. The power loads are seasonal, and the data on the quarterly loads in megawatts (MW) for the last four years are asfollows: Quarter Year 1 Year 2 Year 3 Year 4 1 103.8 92.2 117.2 102.4 2 126.4 113.9 140.5 132.6 3 145.9 139.7 165.7 155.6 4 164.7 150.4 180.5 169.0 The manager estimates the total...
Consider the following time series data. Quarter Year 1 Year 2 Year 3 1 4 6...
Consider the following time series data. Quarter Year 1 Year 2 Year 3 1 4 6 7 2 2 3 6 3 3 5 6 4 5 7 8 (b) Use a multiple regression model with dummy variables as follows to develop an equation to account for seasonal effects in the data. Qtr1 = 1 if Quarter 1, 0 otherwise; Qtr2 = 1 if Quarter 2, 0 otherwise; Qtr3 = 1 if Quarter 3, 0 otherwise. If required, round your...
Six years of quarterly data of a seasonally adjusted series are used to estimate a linear...
 Six years of quarterly data of a seasonally adjusted series are used to estimate a linear trend model as T = 164.90 +1.09. In addition, quarterly seasonal indices are calculated as $ 1-0.88, Ŝ 2=0.94, § 3 = 116, and § 4 = 1.12. b. Make a forecast for all four quarters of next year. (Do not round intermediate calculations. Round your answers to 2 decimal places.) 169.09 Quarter 1 Quarter 2 Quarter 3 Quarter 4
Problem 3-26 The following table shows the past two years of quarterly sales information Assume that...
 Problem 3-26 The following table shows the past two years of quarterly sales information Assume that there are both trend and seasonal factors and that the seasonal cycle is one year QUARTER 1 2 3 4 5 SALES 162 199 158 140 216 239 205 198 8 Use time series decom on to forecast quarterly sales for the next year (Do not round Intermediate calculations. Round your answers to the nearest whole number Quarter 9 10 11 12
An analyst wants to use the ratio-to-moving-average method to forecast a company's sales for the next...
An analyst wants to use the ratio-to-moving-average method to forecast a company's sales for the next few quarters. Beginning in Quarter 1 of 2019, the analyst collects the following sales data (in millions of dollars). Estimate the seasonal index associated with Quarter 2. Round you answer to at least 3 decimal places. Time Period Quarters Sales Moving Average 1 1 98.5 2 2 217.2 139.275 3 3 127.6 142.125 4 4 113.8 159.600 5 1 109.9 163.450 6 2 287.1...
b-2. Using the MAD method of testing the forecasting model's performance, plus actual data from 3...
 b-2. Using the MAD method of testing the forecasting model's performance, plus actual data from 3 years ago through the second quarter of this year, how well did the model perform? Based on MAD, an a performs better than an a of (Click to select) c. Using the decomp (Click to select) 0.3 0.2 hod of forecasting, forecast earnings per share for the last two quarters of this year and all four quarters of next year. (Negative values should be...
The following table reports the sale of umbrellas for 12 quarters. Quarter Year 1 Year 2...
 The following table reports the sale of umbrellas for 12 quarters. Quarter Year 1 Year 2 Year 3 1 4 6 7 2 1 4 5 3 3 5 8 4 5 7 9 Develop a model using Quarter 4 as the reference year and compute the Second Quarterly sales forecast for Year 5. Round your answers to three decimal places.
 The
first quart forecast is _____
The second quarter forecast is _____
The third quarter forecast is _____
The fourth quarter forecast is _____
The manager of a utility company in the Texas panhandle wants to develop quarterly forecasts of power loads for the next year. The power loads are seasonal, and the data on the quarterly loads in megawatts (MW) for the last four years are as follows: Year 1 Year 4 Year 2 98.1 Quarter Year 3 127.6...
The
first quart forecast is _____
The second quarter forecast is _____
The third quarter forecast is _____
The fourth quarter forecast is _____
The manager of a utility company in the Texas panhandle wants to develop quarterly forecasts of power loads for the next year. The power loads are seasonal, and the data on the quarterly loads in megawatts (MW) for the last four years are as follows: Year 1 Year 4 Year 2 98.1 Quarter Year 3 127.6...
 Six years of quarterly data of a seasonally adjusted series are used to estimate a linear trend model as T = 164.90 +1.09. In addition, quarterly seasonal indices are calculated as $ 1-0.88, Ŝ 2=0.94, § 3 = 116, and § 4 = 1.12. b. Make a forecast for all four quarters of next year. (Do not round intermediate calculations. Round your answers to 2 decimal places.) 169.09 Quarter 1 Quarter 2 Quarter 3 Quarter 4
 Problem 3-26 The following table shows the past two years of quarterly sales information Assume that there are both trend and seasonal factors and that the seasonal cycle is one year QUARTER 1 2 3 4 5 SALES 162 199 158 140 216 239 205 198 8 Use time series decom on to forecast quarterly sales for the next year (Do not round Intermediate calculations. Round your answers to the nearest whole number Quarter 9 10 11 12
 b-2. Using the MAD method of testing the forecasting model's performance, plus actual data from 3 years ago through the second quarter of this year, how well did the model perform? Based on MAD, an a performs better than an a of (Click to select) c. Using the decomp (Click to select) 0.3 0.2 hod of forecasting, forecast earnings per share for the last two quarters of this year and all four quarters of next year. (Negative values should be...
 The following table reports the sale of umbrellas for 12 quarters. Quarter Year 1 Year 2 Year 3 1 4 6 7 2 1 4 5 3 3 5 8 4 5 7 9 Develop a model using Quarter 4 as the reference year and compute the Second Quarterly sales forecast for Year 5. Round your answers to three decimal places.
Most questions answered within 3 hours.
-
Where is the error in this code sequence?
String s1 = "Hello";
String s2 = "ello";...
asked 11 months ago -
Financial data for Joel de Paris, Inc., for last year
follow:
Joel de Paris, Inc.
Balance...
asked 11 months ago -
Consider this reaction:
Al2(SO4)3 (aq)+ BaCl3
(aq) Al2Cl6 (aq)- +
3BaSO4(s) . What is the...
asked 11 months ago -
Suppose that Savneet is considering increasing her
recent random sample from 20 car rentals to 40...
asked 11 months ago -
Trucks arrive at an unloading terminal at an average rate of 120
per hour.
Trucks arrive...
asked 11 months ago -
Why are methanol and ethanol completely soluble in water while
octanol is not very little soluble....
asked 11 months ago -
A facilities manager at a university reads in a research report
that the mean amount of...
asked 11 months ago -
When the CuSO4 is rehydrated by adding water to the anhydrous
compound, is this an endothermic...
asked 11 months ago -
A ray of sunlight is passing from diamond into crown glass; the
angle of incidence is...
asked 11 months ago -
A block of mass 0.249 kg is placed on top of a light, vertical
spring of...
asked 11 months ago -
how do the kidneys compensate in the presences of acidosis
a) trigger hyperventilate
b) reserve acid...
asked 11 months ago -
Question 501 pts
The rental rate of capital to the firm increases. Which of the
following...
asked 11 months ago