
Homework Answers
a)
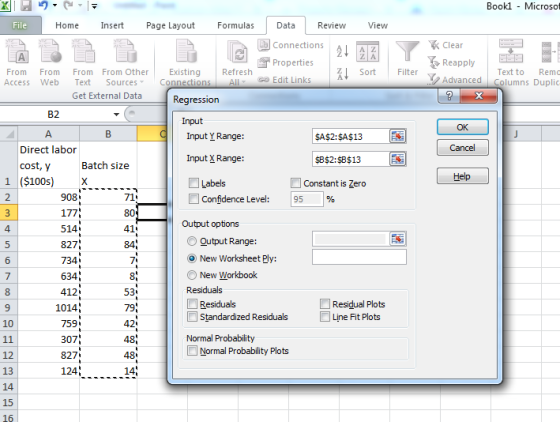
Under the data tab in excel, click on data analysis and select regression.

----------------------------------------------------------------------------------------
Select the data range. The input Y range consists of data from cell A2 to A13. The input X range consists of data from cell B2 to B13.
Once the data range is selected, click ok.
-------------------------------------------------------------------------------------------
The output of the regression analysis is as shown in the summary output.
b0 = intercept = 473.5282
b1 = slope = 2.7038
The equation becomes
y = 473.5282 + 2.7038 x
where y = Direct Labor Cost
x = Batch size
| SUMMARY OUTPUT | ||||||||
| Regression Statistics | ||||||||
| Multiple R | 0.253897 | |||||||
| R Square | 0.064464 | |||||||
| Adjusted R Square | -0.02909 | |||||||
| Standard Error | 297.7582 | |||||||
| Observations | 12 | |||||||
| ANOVA | ||||||||
| df | SS | MS | F | Significance F | ||||
| Regression | 1 | 61091.65 | 61091.65 | 0.689056 | 0.425859 | |||
| Residual | 10 | 886599.3 | 88659.93 | |||||
| Total | 11 | 947690.9 | ||||||
| Coefficients | Standard Error | t Stat | P-value | Lower 95% | Upper 95% | Lower 95.0% | Upper 95.0% | |
| Intercept | 473.5282 | 178.177 | 2.657628 | 0.023997 | 76.52511 | 870.5314 | 76.52511 | 870.5314 |
| X Variable 1 | 2.703758 | 3.257172 | 0.830094 | 0.425859 | -4.55367 | 9.961189 | -4.55367 | 9.961189 |
Add Answer to:
can somebody please tell me how to do it on excel
An accountant wishes to predict...
please explain how to get answers! i rate! :) thank you An accountant wishes to predict...
 please explain how to get answers! i rate! :) thank you
An accountant wishes to predict direct labor cost() on the basis of the batch size (x) of a product produced in a job shop. Data for 12 production runs are given in the table below, along with the Excel output from fitting a least squares regression line to the data. Direct Labor Cost Data Direct Labor Batch Cost, y ($100s) Size, x 619 72 894 626 751 948 979...
please explain how to get answers! i rate! :) thank you
An accountant wishes to predict direct labor cost() on the basis of the batch size (x) of a product produced in a job shop. Data for 12 production runs are given in the table below, along with the Excel output from fitting a least squares regression line to the data. Direct Labor Cost Data Direct Labor Batch Cost, y ($100s) Size, x 619 72 894 626 751 948 979...
Can somebody tell me how to do this question? Part A and B. confused about those...
 Can somebody tell me how to do this
question? Part A and B. confused about those
Mears Production Company makes several products and sells them for an average price of $70. Mears' accountant is considering two different approaches to estimating the firm's total monthly cost function, 1) account analysis, and 2) high-low. In both cases, she used units of production as the independent variable. For the account analysis approach, she developed the cost function by analyzing each cost item in...
Can somebody tell me how to do this
question? Part A and B. confused about those
Mears Production Company makes several products and sells them for an average price of $70. Mears' accountant is considering two different approaches to estimating the firm's total monthly cost function, 1) account analysis, and 2) high-low. In both cases, she used units of production as the independent variable. For the account analysis approach, she developed the cost function by analyzing each cost item in...
can you please show me the work in excel hsing data analysis? thanks! The Central Company...
 can you please show me the work in excel hsing data analysis?
thanks!
The Central Company manufactures a certain specialty item once a month in a batch production run. The number of items produced in each run varies from month to month as demand fluctuates. The company is interested in the relationship between the size of the production run (x) and the number of hours of labor (y) required for the run. The company has collected the following data for...
can you please show me the work in excel hsing data analysis?
thanks!
The Central Company manufactures a certain specialty item once a month in a batch production run. The number of items produced in each run varies from month to month as demand fluctuates. The company is interested in the relationship between the size of the production run (x) and the number of hours of labor (y) required for the run. The company has collected the following data for...
can somebody please help me understand how to do this correctly? I would be so grateful!...
 can somebody please help me understand how to do this
correctly? I would be so grateful!
Dawah Cemery pretter det for arted at the b ote 14,100 3102) 14.00 337) during January from Weaving Department, 22, January indices de recerca Plec ted Karache Cape r y Cost Production Reporting Dept For the Mer Erded landry Win Down r ted for the cute To eBook Calculator Printem Lisbe and costs Whole Units Equivalent Units Direct Materials 0 Inventory in process, January...
can somebody please help me understand how to do this
correctly? I would be so grateful!
Dawah Cemery pretter det for arted at the b ote 14,100 3102) 14.00 337) during January from Weaving Department, 22, January indices de recerca Plec ted Karache Cape r y Cost Production Reporting Dept For the Mer Erded landry Win Down r ted for the cute To eBook Calculator Printem Lisbe and costs Whole Units Equivalent Units Direct Materials 0 Inventory in process, January...
 please explain how to get answers! i rate! :) thank you
An accountant wishes to predict direct labor cost() on the basis of the batch size (x) of a product produced in a job shop. Data for 12 production runs are given in the table below, along with the Excel output from fitting a least squares regression line to the data. Direct Labor Cost Data Direct Labor Batch Cost, y ($100s) Size, x 619 72 894 626 751 948 979...
please explain how to get answers! i rate! :) thank you
An accountant wishes to predict direct labor cost() on the basis of the batch size (x) of a product produced in a job shop. Data for 12 production runs are given in the table below, along with the Excel output from fitting a least squares regression line to the data. Direct Labor Cost Data Direct Labor Batch Cost, y ($100s) Size, x 619 72 894 626 751 948 979...
 Can somebody tell me how to do this
question? Part A and B. confused about those
Mears Production Company makes several products and sells them for an average price of $70. Mears' accountant is considering two different approaches to estimating the firm's total monthly cost function, 1) account analysis, and 2) high-low. In both cases, she used units of production as the independent variable. For the account analysis approach, she developed the cost function by analyzing each cost item in...
Can somebody tell me how to do this
question? Part A and B. confused about those
Mears Production Company makes several products and sells them for an average price of $70. Mears' accountant is considering two different approaches to estimating the firm's total monthly cost function, 1) account analysis, and 2) high-low. In both cases, she used units of production as the independent variable. For the account analysis approach, she developed the cost function by analyzing each cost item in...
 can you please show me the work in excel hsing data analysis?
thanks!
The Central Company manufactures a certain specialty item once a month in a batch production run. The number of items produced in each run varies from month to month as demand fluctuates. The company is interested in the relationship between the size of the production run (x) and the number of hours of labor (y) required for the run. The company has collected the following data for...
can you please show me the work in excel hsing data analysis?
thanks!
The Central Company manufactures a certain specialty item once a month in a batch production run. The number of items produced in each run varies from month to month as demand fluctuates. The company is interested in the relationship between the size of the production run (x) and the number of hours of labor (y) required for the run. The company has collected the following data for...
 can somebody please help me understand how to do this
correctly? I would be so grateful!
Dawah Cemery pretter det for arted at the b ote 14,100 3102) 14.00 337) during January from Weaving Department, 22, January indices de recerca Plec ted Karache Cape r y Cost Production Reporting Dept For the Mer Erded landry Win Down r ted for the cute To eBook Calculator Printem Lisbe and costs Whole Units Equivalent Units Direct Materials 0 Inventory in process, January...
can somebody please help me understand how to do this
correctly? I would be so grateful!
Dawah Cemery pretter det for arted at the b ote 14,100 3102) 14.00 337) during January from Weaving Department, 22, January indices de recerca Plec ted Karache Cape r y Cost Production Reporting Dept For the Mer Erded landry Win Down r ted for the cute To eBook Calculator Printem Lisbe and costs Whole Units Equivalent Units Direct Materials 0 Inventory in process, January...
Most questions answered within 3 hours.
-
Where is the error in this code sequence?
String s1 = "Hello";
String s2 = "ello";...
asked 10 months ago -
Financial data for Joel de Paris, Inc., for last year
follow:
Joel de Paris, Inc.
Balance...
asked 10 months ago -
Consider this reaction:
Al2(SO4)3 (aq)+ BaCl3
(aq) Al2Cl6 (aq)- +
3BaSO4(s) . What is the...
asked 10 months ago -
Suppose that Savneet is considering increasing her
recent random sample from 20 car rentals to 40...
asked 10 months ago -
Trucks arrive at an unloading terminal at an average rate of 120
per hour.
Trucks arrive...
asked 10 months ago -
Why are methanol and ethanol completely soluble in water while
octanol is not very little soluble....
asked 10 months ago -
A facilities manager at a university reads in a research report
that the mean amount of...
asked 10 months ago -
When the CuSO4 is rehydrated by adding water to the anhydrous
compound, is this an endothermic...
asked 10 months ago -
A ray of sunlight is passing from diamond into crown glass; the
angle of incidence is...
asked 10 months ago -
A block of mass 0.249 kg is placed on top of a light, vertical
spring of...
asked 10 months ago -
how do the kidneys compensate in the presences of acidosis
a) trigger hyperventilate
b) reserve acid...
asked 10 months ago -
Question 501 pts
The rental rate of capital to the firm increases. Which of the
following...
asked 10 months ago