
Homework Answers
Add Answer to:
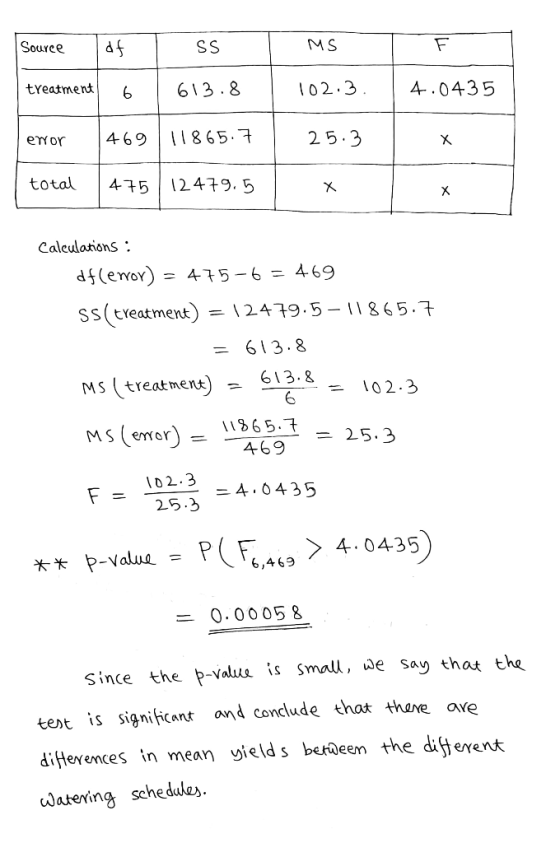
6. Seven different watering schedules are tested for a certain crop. Yields of the plants subject...
The following data were collected from a repeated measures study which tested the effect of physiological...
 The following data were collected from a repeated measures study which tested the effect of physiological biofeedback therapy on the reduction of state-anxiety scores across four sessions. Conduct an ANOVA to determine if there is a significant effect of this therapy. Treatments lt 10 ? = 332 Ta=24 G- 60 SSA-24 T's = 16 SS 14 Te = 12 SSc 26 TD = 8 SS 8 Attach File Browse My Computer 10 points Save Answer ESTION 27 Complete the missing...
Attempts: Average: /12 ANOVA calculations and rejection of the null hypothesis Aa Aa The followin...
 Please answer all parts
Attempts: Average: /12 ANOVA calculations and rejection of the null hypothesis Aa Aa The following table summarizes the results of a study on SAT prep courses, comparing SAT scores of students in a private preparation class, a high school preparation class, and no preparation class. Use the information from the table to answer the remaining questions. Number of Sum of Observations Sample Mean Squares (SS) 650 645 625 Treatment Private prep class High school prep class...
Please answer all parts
Attempts: Average: /12 ANOVA calculations and rejection of the null hypothesis Aa Aa The following table summarizes the results of a study on SAT prep courses, comparing SAT scores of students in a private preparation class, a high school preparation class, and no preparation class. Use the information from the table to answer the remaining questions. Number of Sum of Observations Sample Mean Squares (SS) 650 645 625 Treatment Private prep class High school prep class...
CENGAGE I MINDTAP Complete: Chapter 12 Problem Set 6. ANOVA calculations and rejection of the nul...
 CENGAGE I MINDTAP Complete: Chapter 12 Problem Set 6. ANOVA calculations and rejection of the null hypothesis Click here to learn ollowing table summarizes the results of a study on SAT prep courses, com private preparation class, table to answer the remaining questions aring SAT scores of students in a a high school preparation class, and no preparation class. Use the information from the Sum of Squares (ss) 132,750.00 147,500.00 162,250.00 60 645 No prep class 625 Using the data...
The following table summarizes the results of a study on SAT prep courses, comparing SAT scores...
 The following table summarizes the results of a study on SAT prep courses, comparing SAT scores of students in a private preparation class, a high school preparation class, and no preparation class. Use the information from the table to answer the remaining questions Number of Sum of Treatment Private prep class High school prep class No prep class Observations Sample Mean Squares (SS) 690 680 640 60 60 60 265,500.00 276,120.00 302,670.00 Using the data provided, complete the partial ANOVA...
4. Repeated-measures ANOVA Aa Aa Suppose you are interested in studying whether lighting brightness affects spatial reasoning abilities. You decide to test spatial reasoning using completion time sco...
 4. Repeated-measures ANOVA Aa Aa Suppose you are interested in studying whether lighting brightness affects spatial reasoning abilities. You decide to test spatial reasoning using completion time scores for the paper-folding test with five people, repeating the test on each person with three different lighting levels (800, 1,000, and 1,200 lux) In this experiment, the null hypothesis is that: O There are no individual differences in the completion time means O The completion time mean for at least one lighting...
2.) The data below are from an independent-measures experiment comparing the effects of insomnia treatments. Treatment...
 2.) The data below are from an independent-measures experiment comparing the effects of insomnia treatments. Treatment 1 is a control group, Treatment 2 meditated before sleeping, and Treatment 3 received a sleeping pill. Note Pay close attention to what information you are given! Treatment1 Treatment 2 Treatment 3 6 G-36 T2 = 8 SS2 -6 T's = 24 SS-6 SS: = 6 a.Complete the ANOVA summary table below to help determine whether these data indicate any significant mean differences among...
Wilfley and colleagues (2008) tested whether the antiobesity drug sibutramine would be an effective treatment for...
Wilfley and colleagues (2008) tested whether the antiobesity drug sibutramine would be an effective treatment for people with binge eating disorder. They measured the frequency of binge eating every 2 weeks for 24 weeks during treatment. The following table lists a portion of the data similar to results reported by the authors for the frequency of binge eating over the first 8 weeks of the drug treatment. Frequency of Binge Eating Baseline Week 2 Week 4 Week 6 Week 8....
A study of 6 different weight loss programs involved 120 subjects. Each of the 6 programs...
A study of 6 different weight loss programs involved 120 subjects. Each of the 6 programs had 20 subjects in it. The subjects were followed for 12 months. Weight change for each subject was recorded. We want to test the claim that the mean weight loss is the same for the 6 programs. (a) Complete the following ANOVA table with sum of squares, degrees of freedom, and mean square (Show all work): Source of Variation Sum of Squares (SS) Degrees...
Wilfley and colleagues (2008) tested whether the antiobesity drug sibutramine would be an effective treatment for...
Wilfley and colleagues (2008) tested whether the antiobesity drug sibutramine would be an effective treatment for people with binge eating disorder. They measured the frequency of binge eating every 2 weeks for 24 weeks during treatment. The following table lists a portion of the data similar to results reported by the authors for the frequency of binge eating over the first 8 weeks of the drug treatment. Frequency of Binge Eating Baseline Week 2 Week 4 Week 6 Week 8...
A study of the effect of television commercials on 12-year-old children measured their attention span, in seconds. Th...
 A study of the effect of television commercials on 12-year-old children measured their attention span, in seconds. The commercials were for clothes, food, and toys. Clothes Food Toys 26 45 60 21 48 51 43 43 43 35 53 54 28 47 63 31 42 53 17 34 48 31 43 58 20 57 47 47 51 51 44 54 Click here for the EXCel Data File 1. Complete the ANOVA table. Use 0.05 significance level. (Round the SS and...
 The following data were collected from a repeated measures study which tested the effect of physiological biofeedback therapy on the reduction of state-anxiety scores across four sessions. Conduct an ANOVA to determine if there is a significant effect of this therapy. Treatments lt 10 ? = 332 Ta=24 G- 60 SSA-24 T's = 16 SS 14 Te = 12 SSc 26 TD = 8 SS 8 Attach File Browse My Computer 10 points Save Answer ESTION 27 Complete the missing...
 Please answer all parts
Attempts: Average: /12 ANOVA calculations and rejection of the null hypothesis Aa Aa The following table summarizes the results of a study on SAT prep courses, comparing SAT scores of students in a private preparation class, a high school preparation class, and no preparation class. Use the information from the table to answer the remaining questions. Number of Sum of Observations Sample Mean Squares (SS) 650 645 625 Treatment Private prep class High school prep class...
Please answer all parts
Attempts: Average: /12 ANOVA calculations and rejection of the null hypothesis Aa Aa The following table summarizes the results of a study on SAT prep courses, comparing SAT scores of students in a private preparation class, a high school preparation class, and no preparation class. Use the information from the table to answer the remaining questions. Number of Sum of Observations Sample Mean Squares (SS) 650 645 625 Treatment Private prep class High school prep class...
 CENGAGE I MINDTAP Complete: Chapter 12 Problem Set 6. ANOVA calculations and rejection of the null hypothesis Click here to learn ollowing table summarizes the results of a study on SAT prep courses, com private preparation class, table to answer the remaining questions aring SAT scores of students in a a high school preparation class, and no preparation class. Use the information from the Sum of Squares (ss) 132,750.00 147,500.00 162,250.00 60 645 No prep class 625 Using the data...
 The following table summarizes the results of a study on SAT prep courses, comparing SAT scores of students in a private preparation class, a high school preparation class, and no preparation class. Use the information from the table to answer the remaining questions Number of Sum of Treatment Private prep class High school prep class No prep class Observations Sample Mean Squares (SS) 690 680 640 60 60 60 265,500.00 276,120.00 302,670.00 Using the data provided, complete the partial ANOVA...
 4. Repeated-measures ANOVA Aa Aa Suppose you are interested in studying whether lighting brightness affects spatial reasoning abilities. You decide to test spatial reasoning using completion time scores for the paper-folding test with five people, repeating the test on each person with three different lighting levels (800, 1,000, and 1,200 lux) In this experiment, the null hypothesis is that: O There are no individual differences in the completion time means O The completion time mean for at least one lighting...
 2.) The data below are from an independent-measures experiment comparing the effects of insomnia treatments. Treatment 1 is a control group, Treatment 2 meditated before sleeping, and Treatment 3 received a sleeping pill. Note Pay close attention to what information you are given! Treatment1 Treatment 2 Treatment 3 6 G-36 T2 = 8 SS2 -6 T's = 24 SS-6 SS: = 6 a.Complete the ANOVA summary table below to help determine whether these data indicate any significant mean differences among...
 A study of the effect of television commercials on 12-year-old children measured their attention span, in seconds. The commercials were for clothes, food, and toys. Clothes Food Toys 26 45 60 21 48 51 43 43 43 35 53 54 28 47 63 31 42 53 17 34 48 31 43 58 20 57 47 47 51 51 44 54 Click here for the EXCel Data File 1. Complete the ANOVA table. Use 0.05 significance level. (Round the SS and...
Most questions answered within 3 hours.
-
Where is the error in this code sequence?
String s1 = "Hello";
String s2 = "ello";...
asked 10 months ago -
Financial data for Joel de Paris, Inc., for last year
follow:
Joel de Paris, Inc.
Balance...
asked 10 months ago -
Consider this reaction:
Al2(SO4)3 (aq)+ BaCl3
(aq) Al2Cl6 (aq)- +
3BaSO4(s) . What is the...
asked 10 months ago -
Suppose that Savneet is considering increasing her
recent random sample from 20 car rentals to 40...
asked 10 months ago -
Trucks arrive at an unloading terminal at an average rate of 120
per hour.
Trucks arrive...
asked 10 months ago -
Why are methanol and ethanol completely soluble in water while
octanol is not very little soluble....
asked 10 months ago -
A facilities manager at a university reads in a research report
that the mean amount of...
asked 10 months ago -
When the CuSO4 is rehydrated by adding water to the anhydrous
compound, is this an endothermic...
asked 10 months ago -
A ray of sunlight is passing from diamond into crown glass; the
angle of incidence is...
asked 10 months ago -
A block of mass 0.249 kg is placed on top of a light, vertical
spring of...
asked 10 months ago -
how do the kidneys compensate in the presences of acidosis
a) trigger hyperventilate
b) reserve acid...
asked 10 months ago -
Question 501 pts
The rental rate of capital to the firm increases. Which of the
following...
asked 10 months ago